
Soil Mechanics and Foundation Engineering/ Dr. Ahmad Fahmi / Professional Excel Spreadsheet Designer
In the name of God /Dr. Ahmad Fahmi's Weblog
Soil Mechanics and Foundation Engineering/ Dr. Ahmad Fahmi / Professional Excel Spreadsheet Designer
In the name of God /Dr. Ahmad Fahmi's WeblogSoil Phase Relationships
Soil Mechanics Lecture
Soil phase relationships describe how solids, water, and air coexist in a given volume of soil and are essential in understanding soil behavior. These relationships are crucial for assessing characteristics like density, porosity, saturation rate, and moisture content, all of which directly impact soil’s engineering performance. By examining the proportions of solids, water, and air, engineers can determine how well the soil can support loads, retain moisture, or drain. Soil that is fully saturated has no air voids, while partially saturated soils contain both air and water within their void spaces. These relationships offer insights into soil's stability, compressibility, and permeability, which are necessary for effective design in construction and environmental applications.
Watch the Related Videos on Our YouTube Channel (in English):
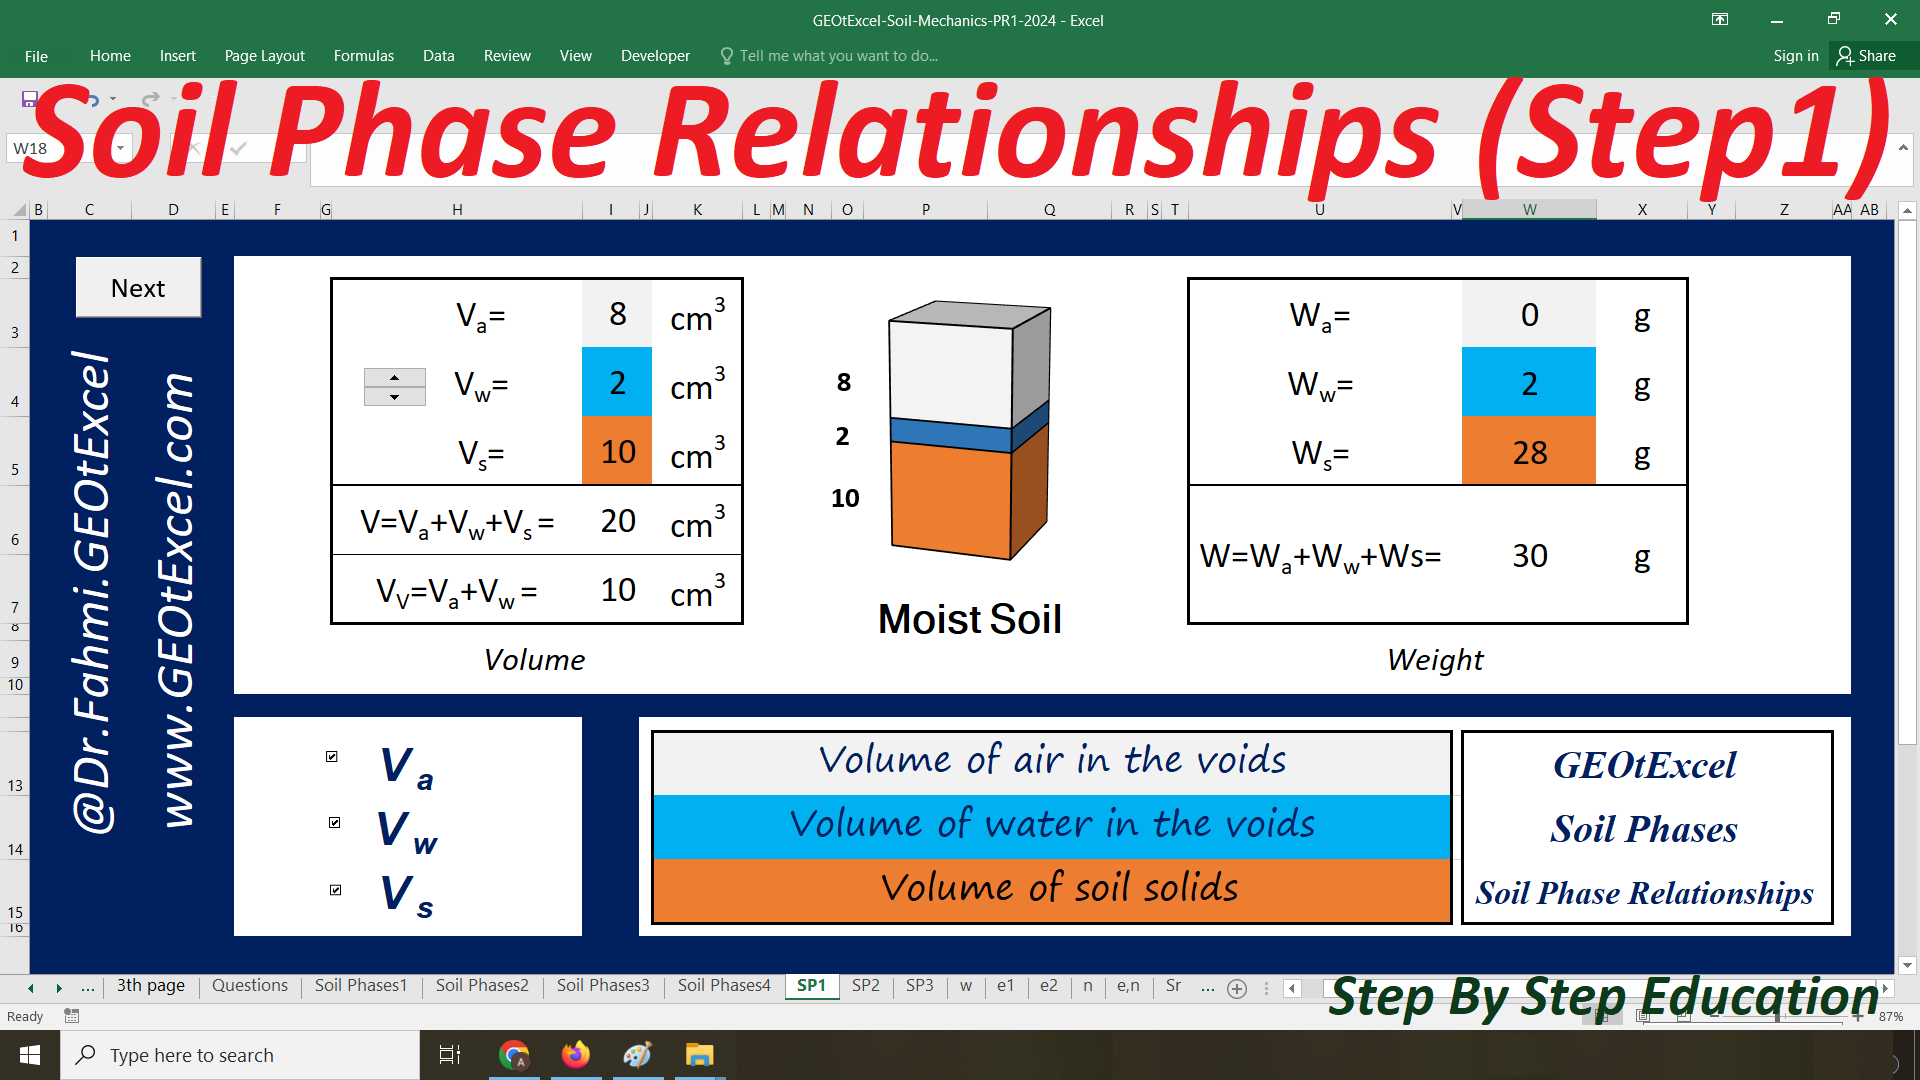
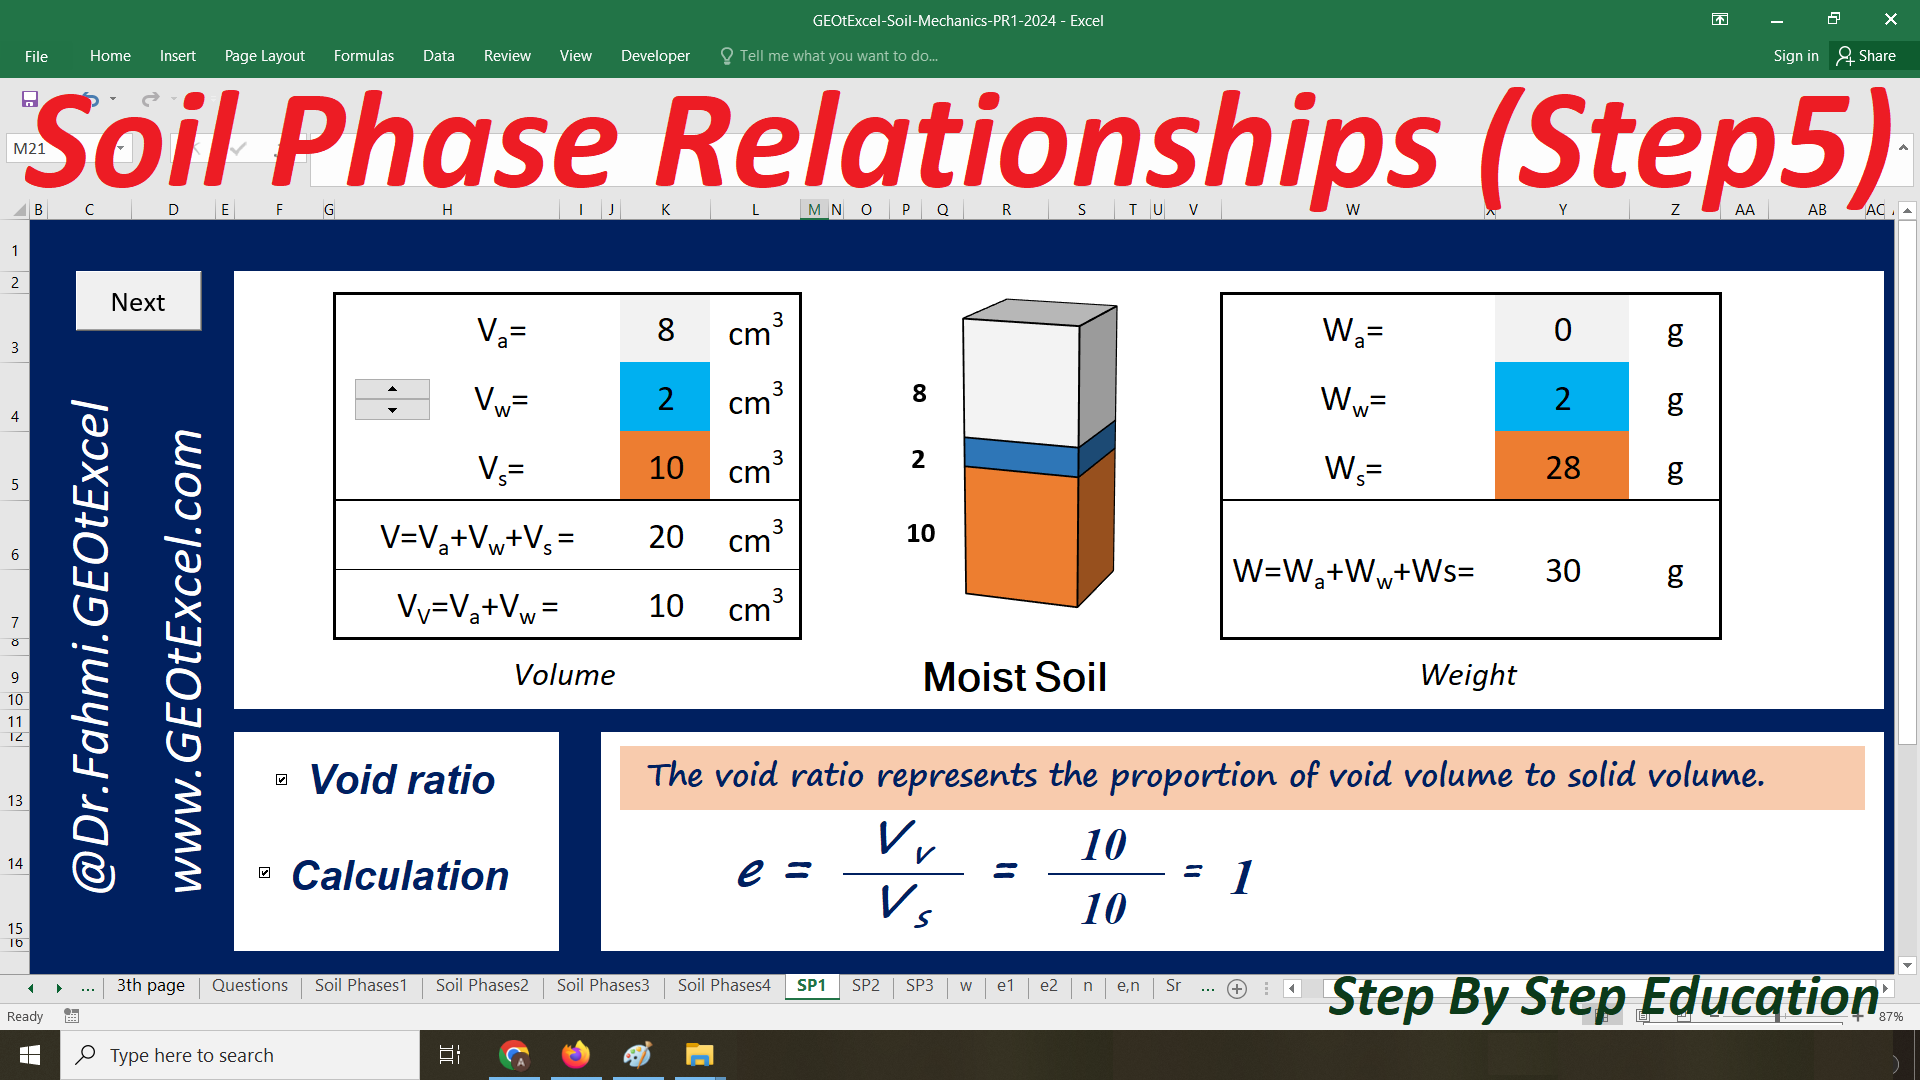
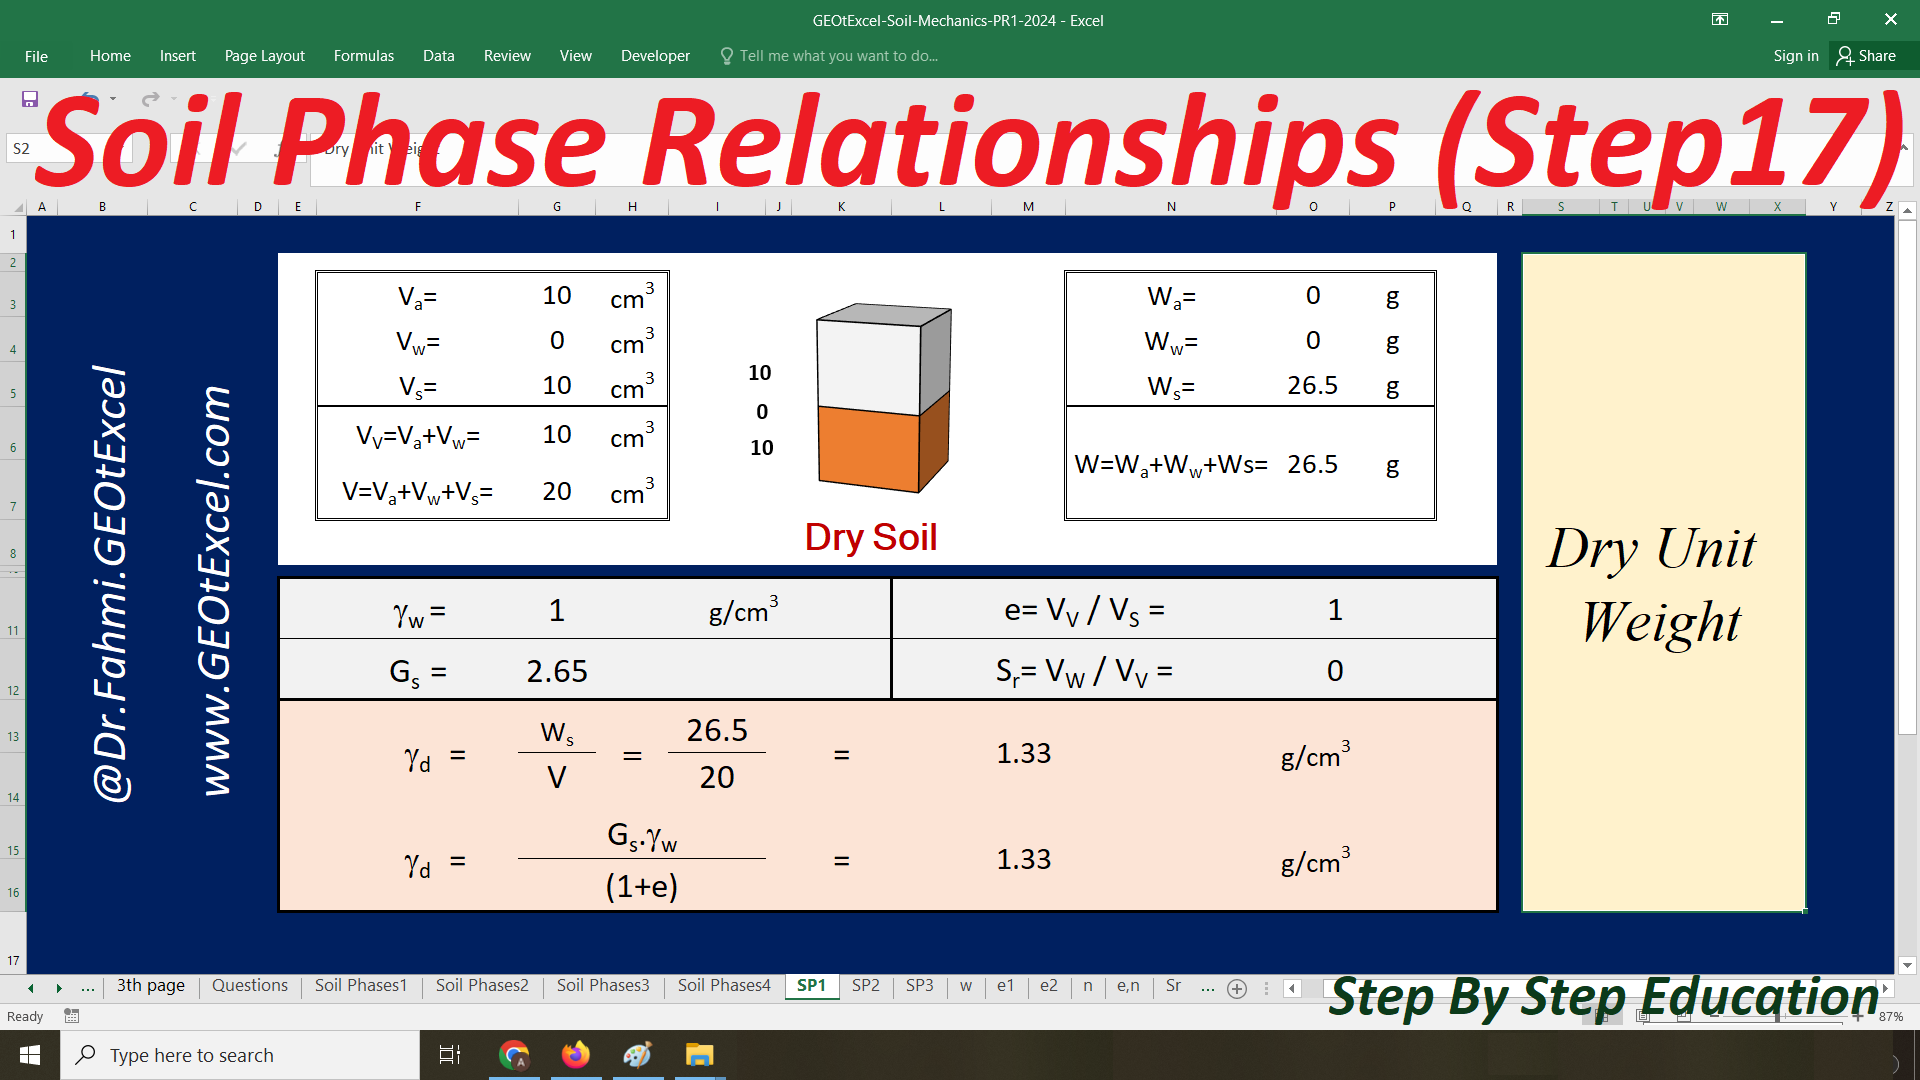
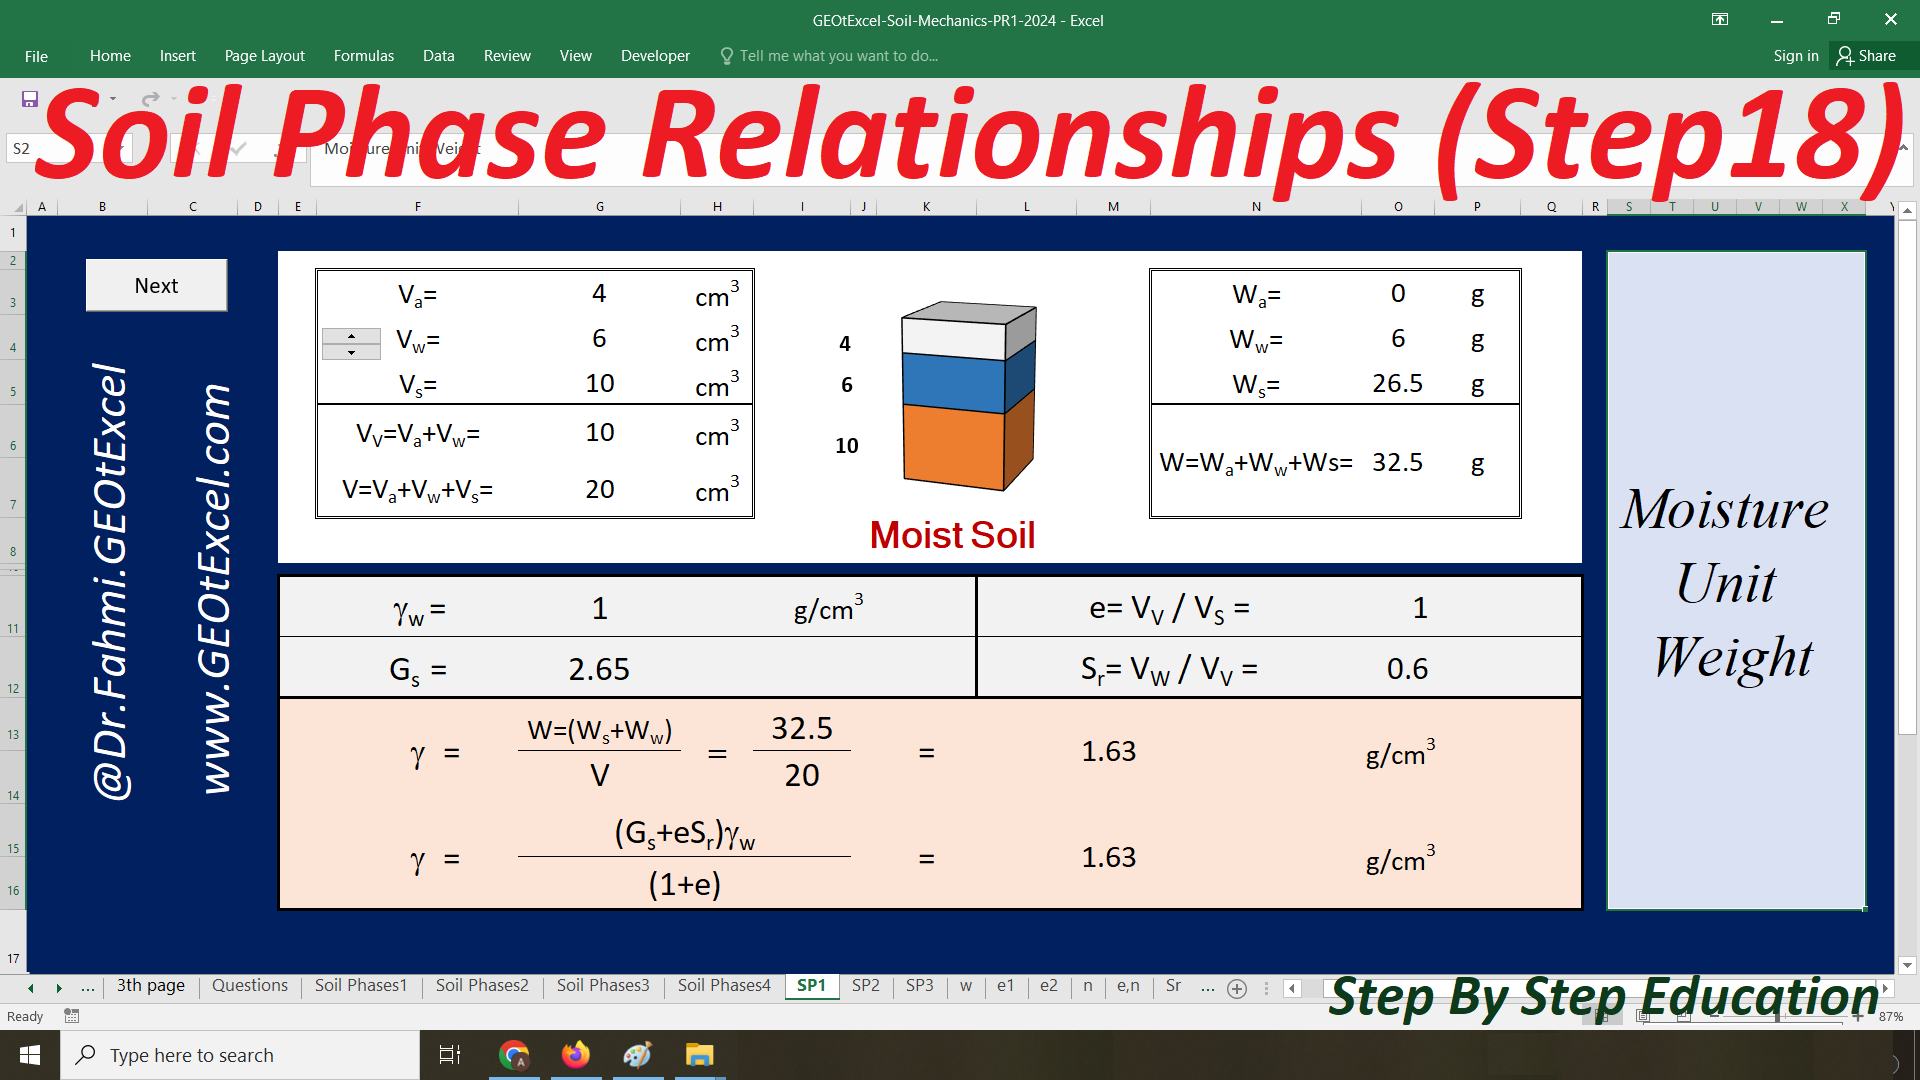
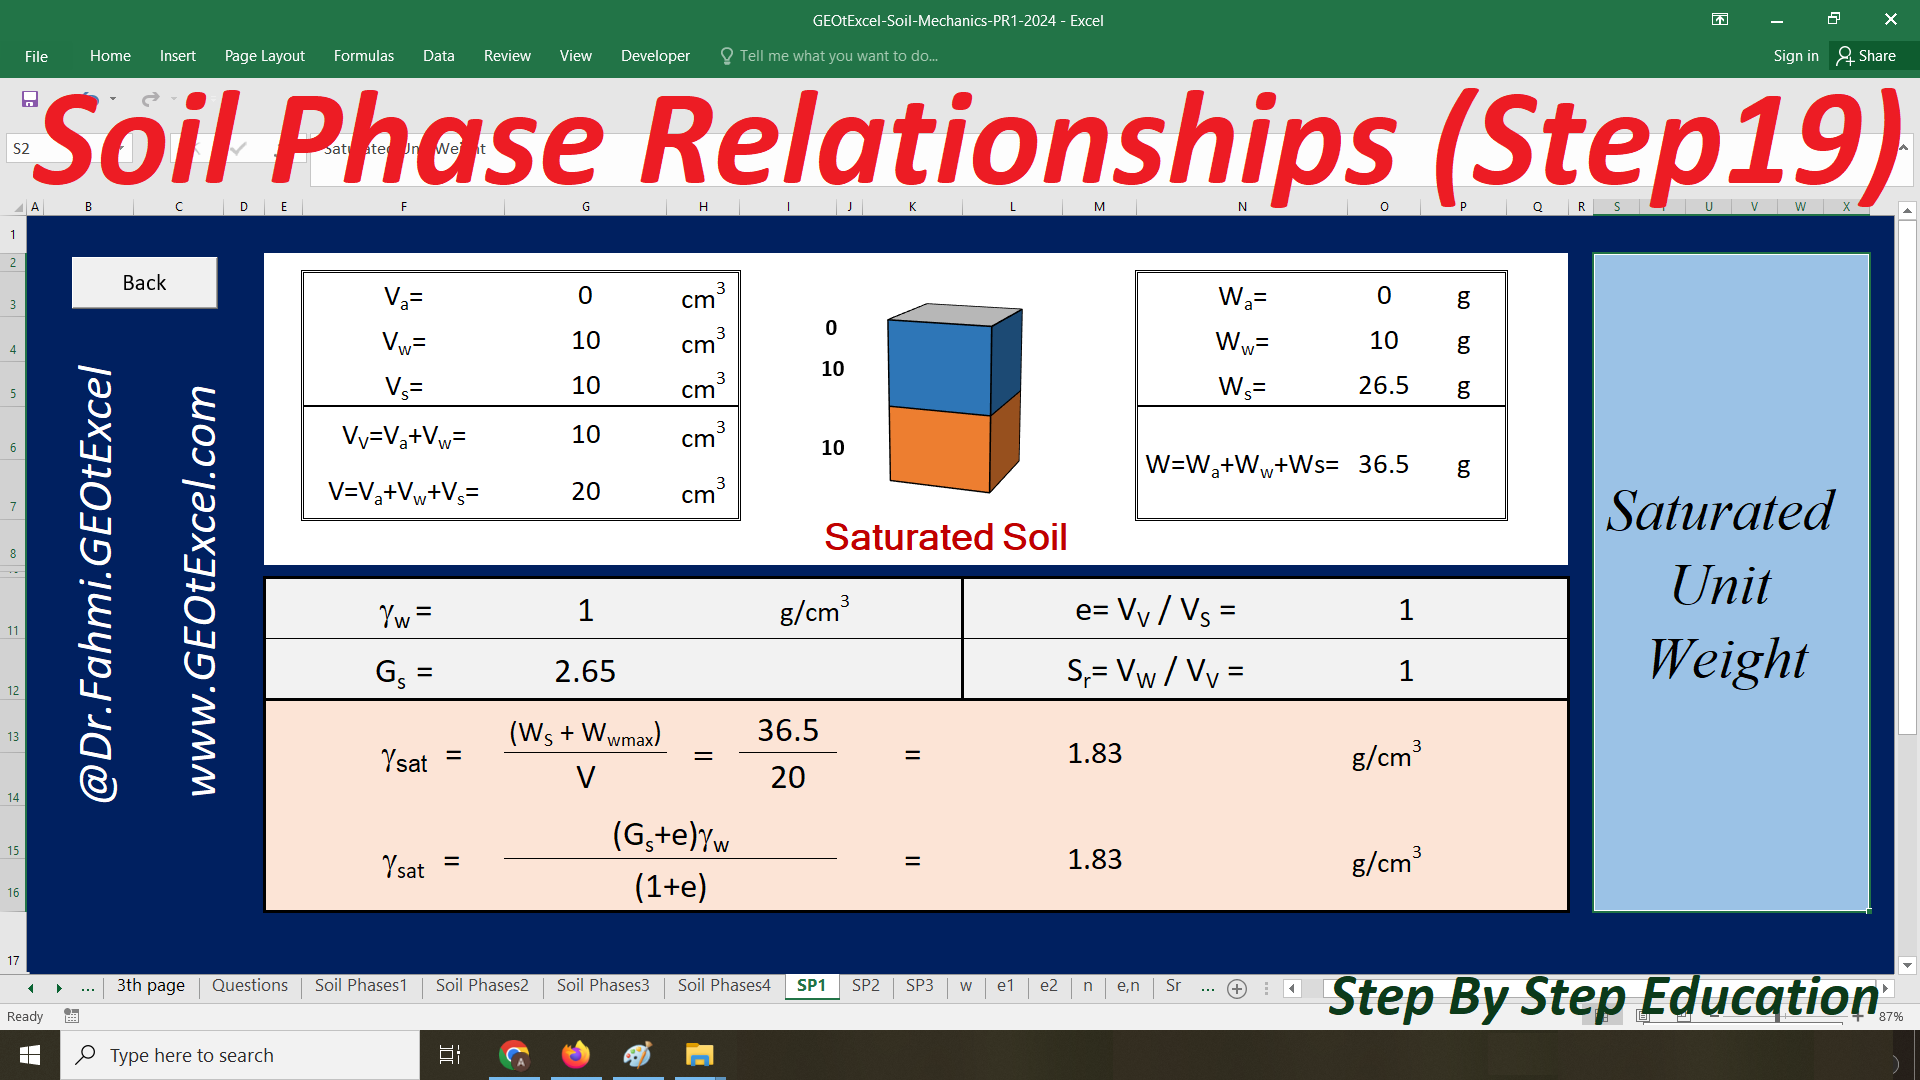
Volume of air in the voids
Volume of water in the voids
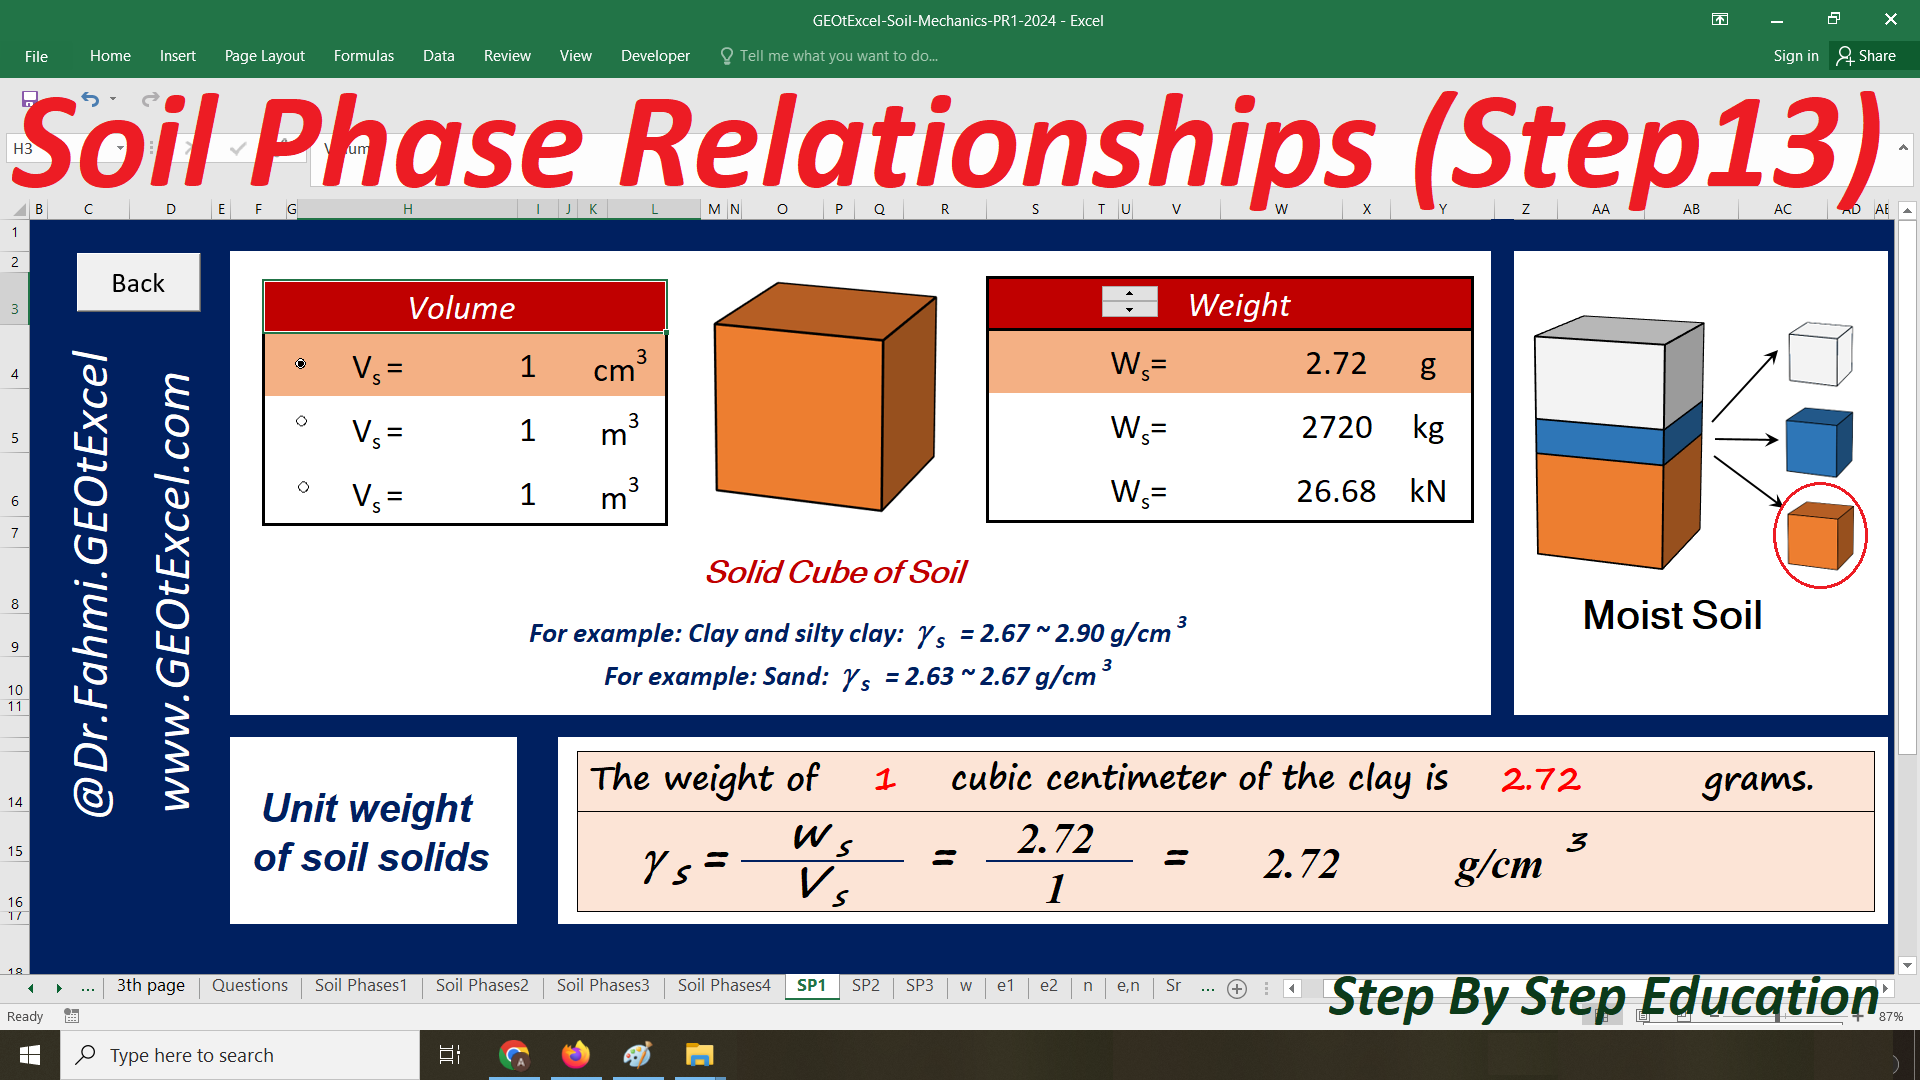
Volume of soil solids
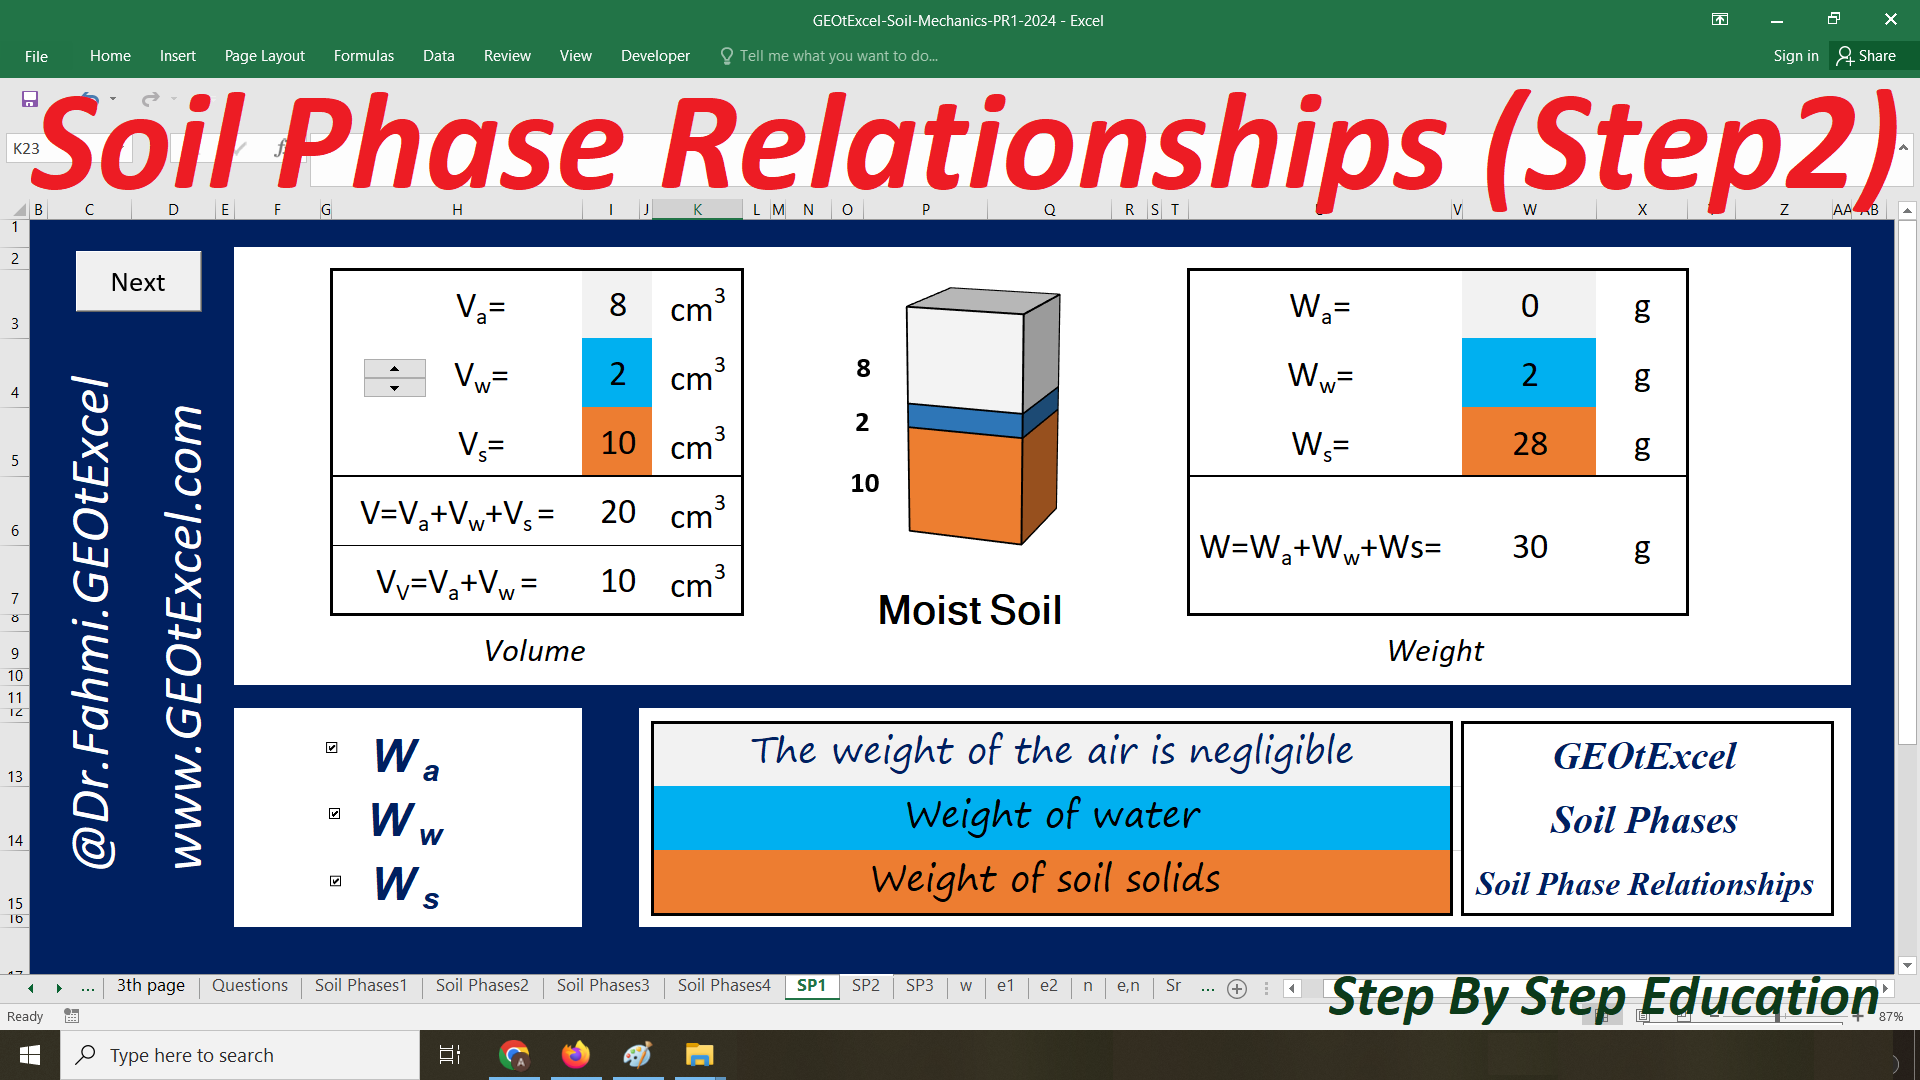
The weight of the air is negligible
Weight of water
Weight of soil solids
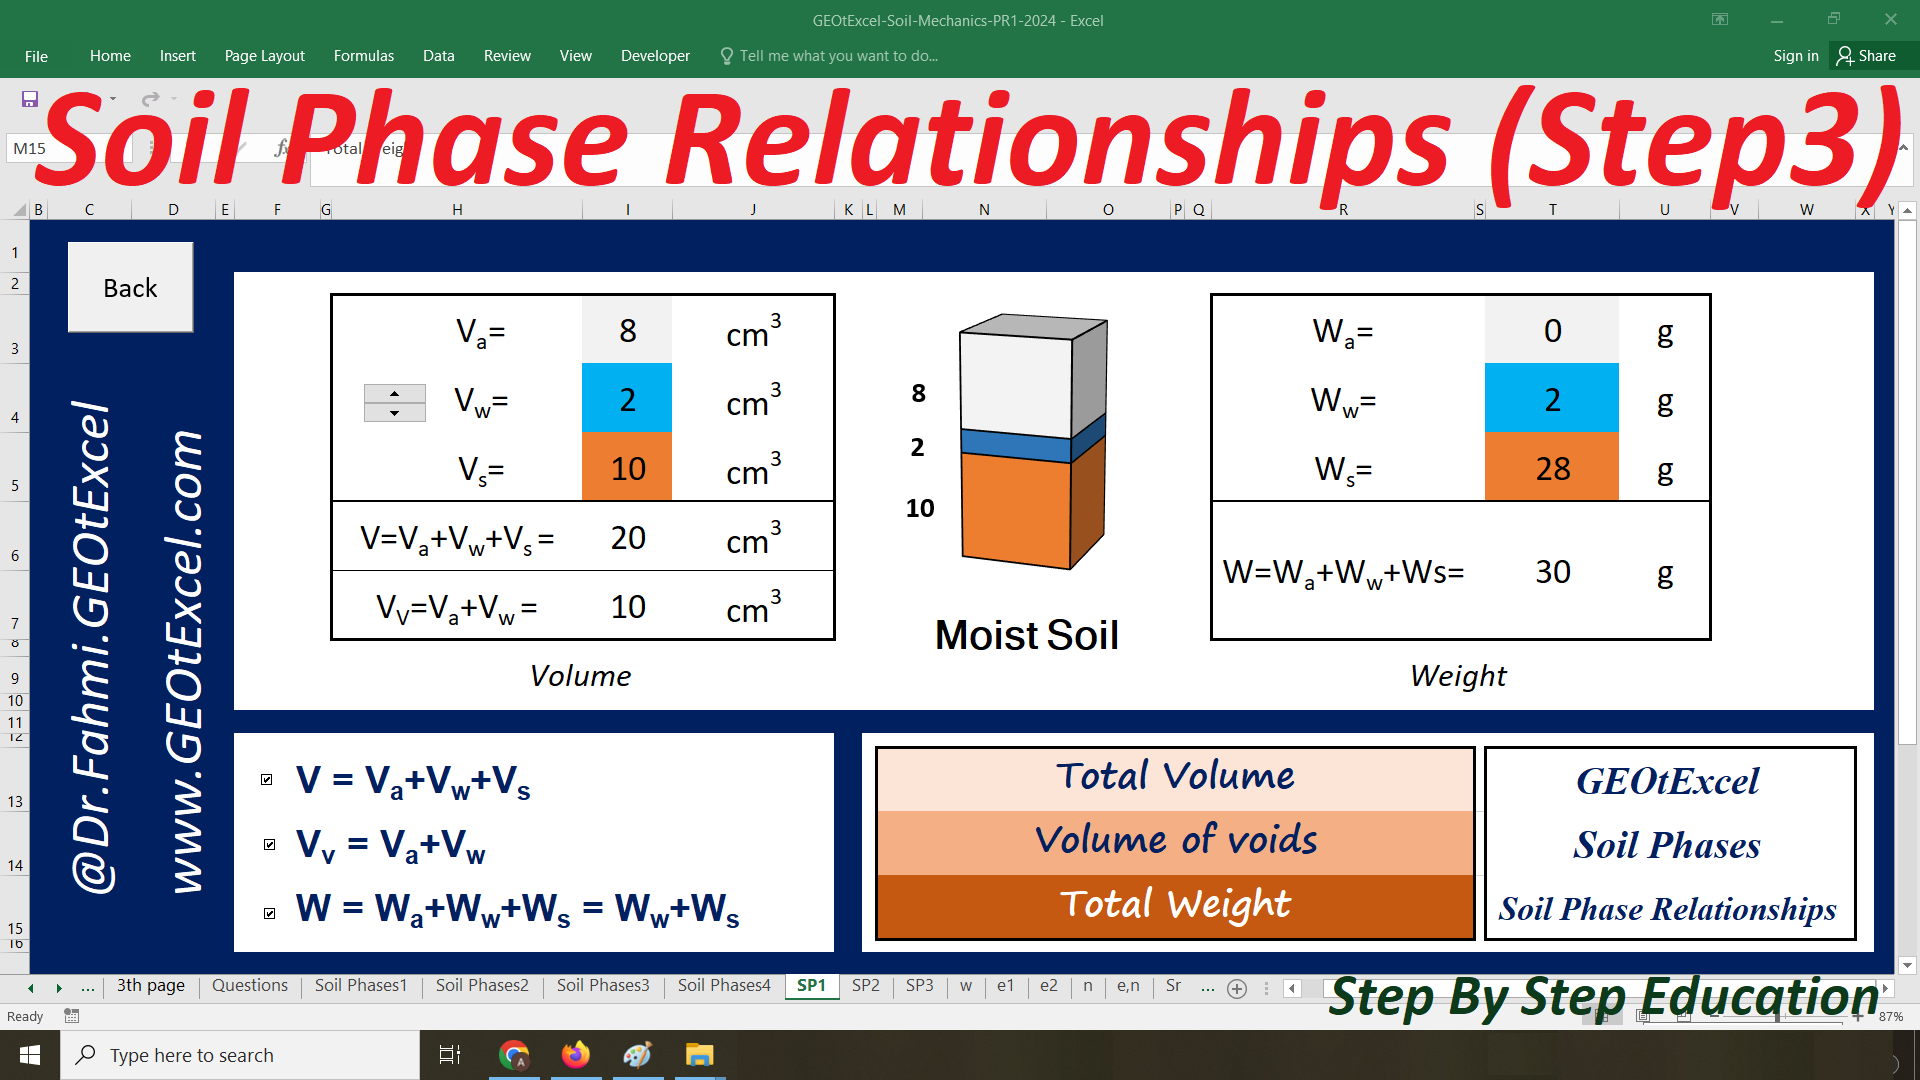
Total Volume
Volume of voids
Total Weight
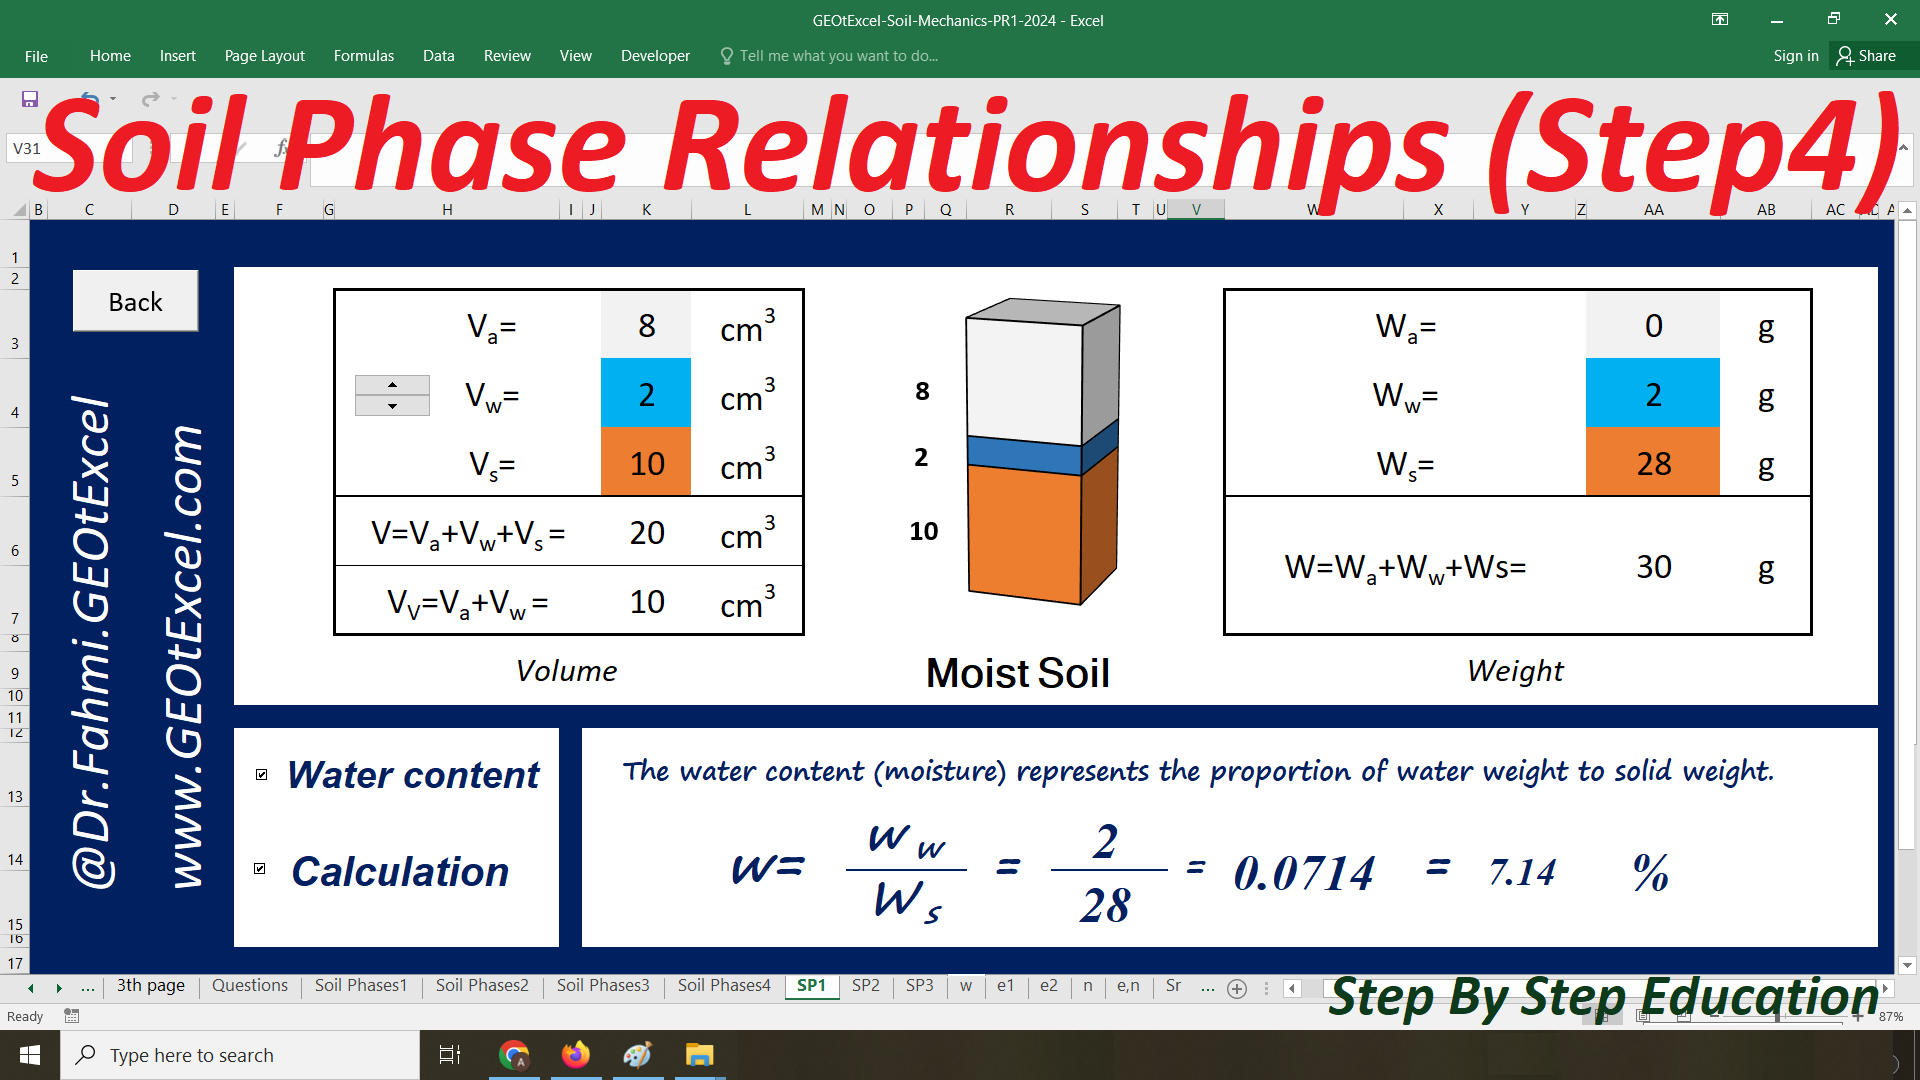
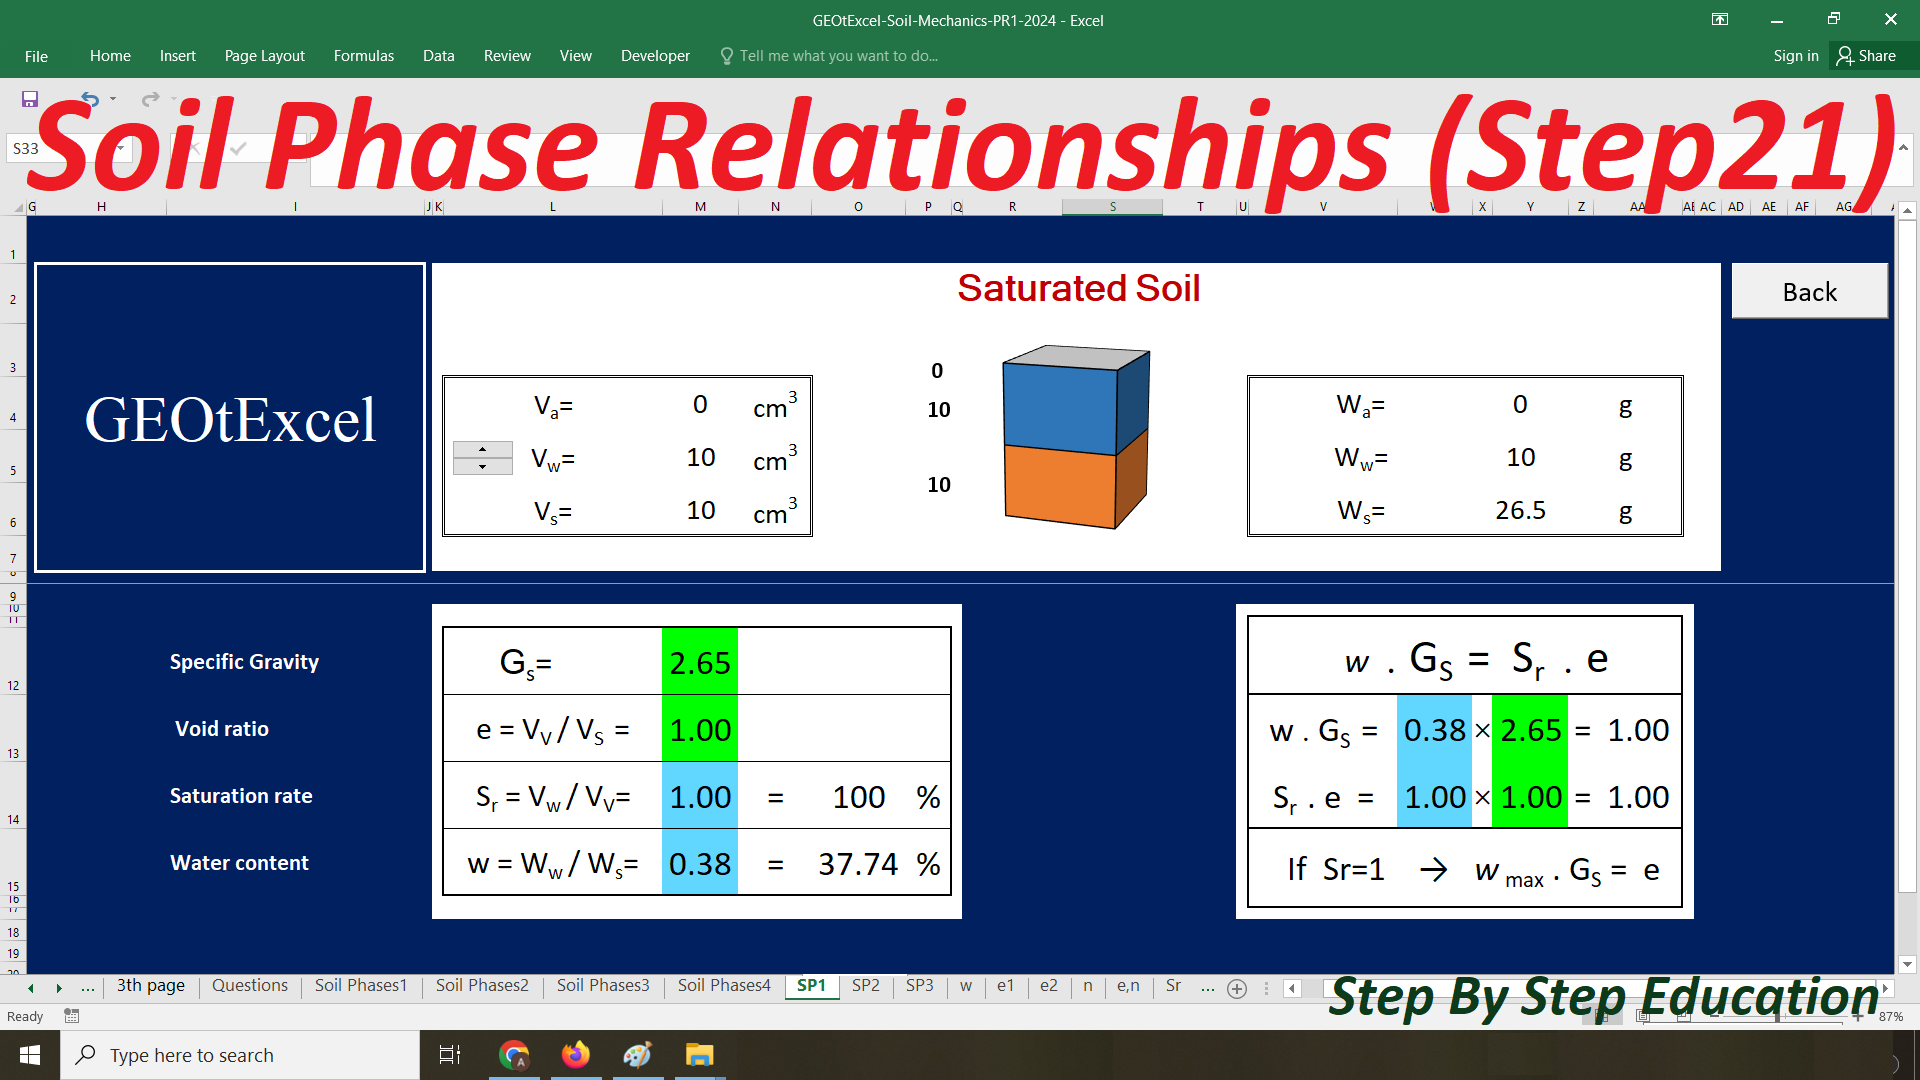
The water content (moisture) represents the proportion of water weight to solid weight
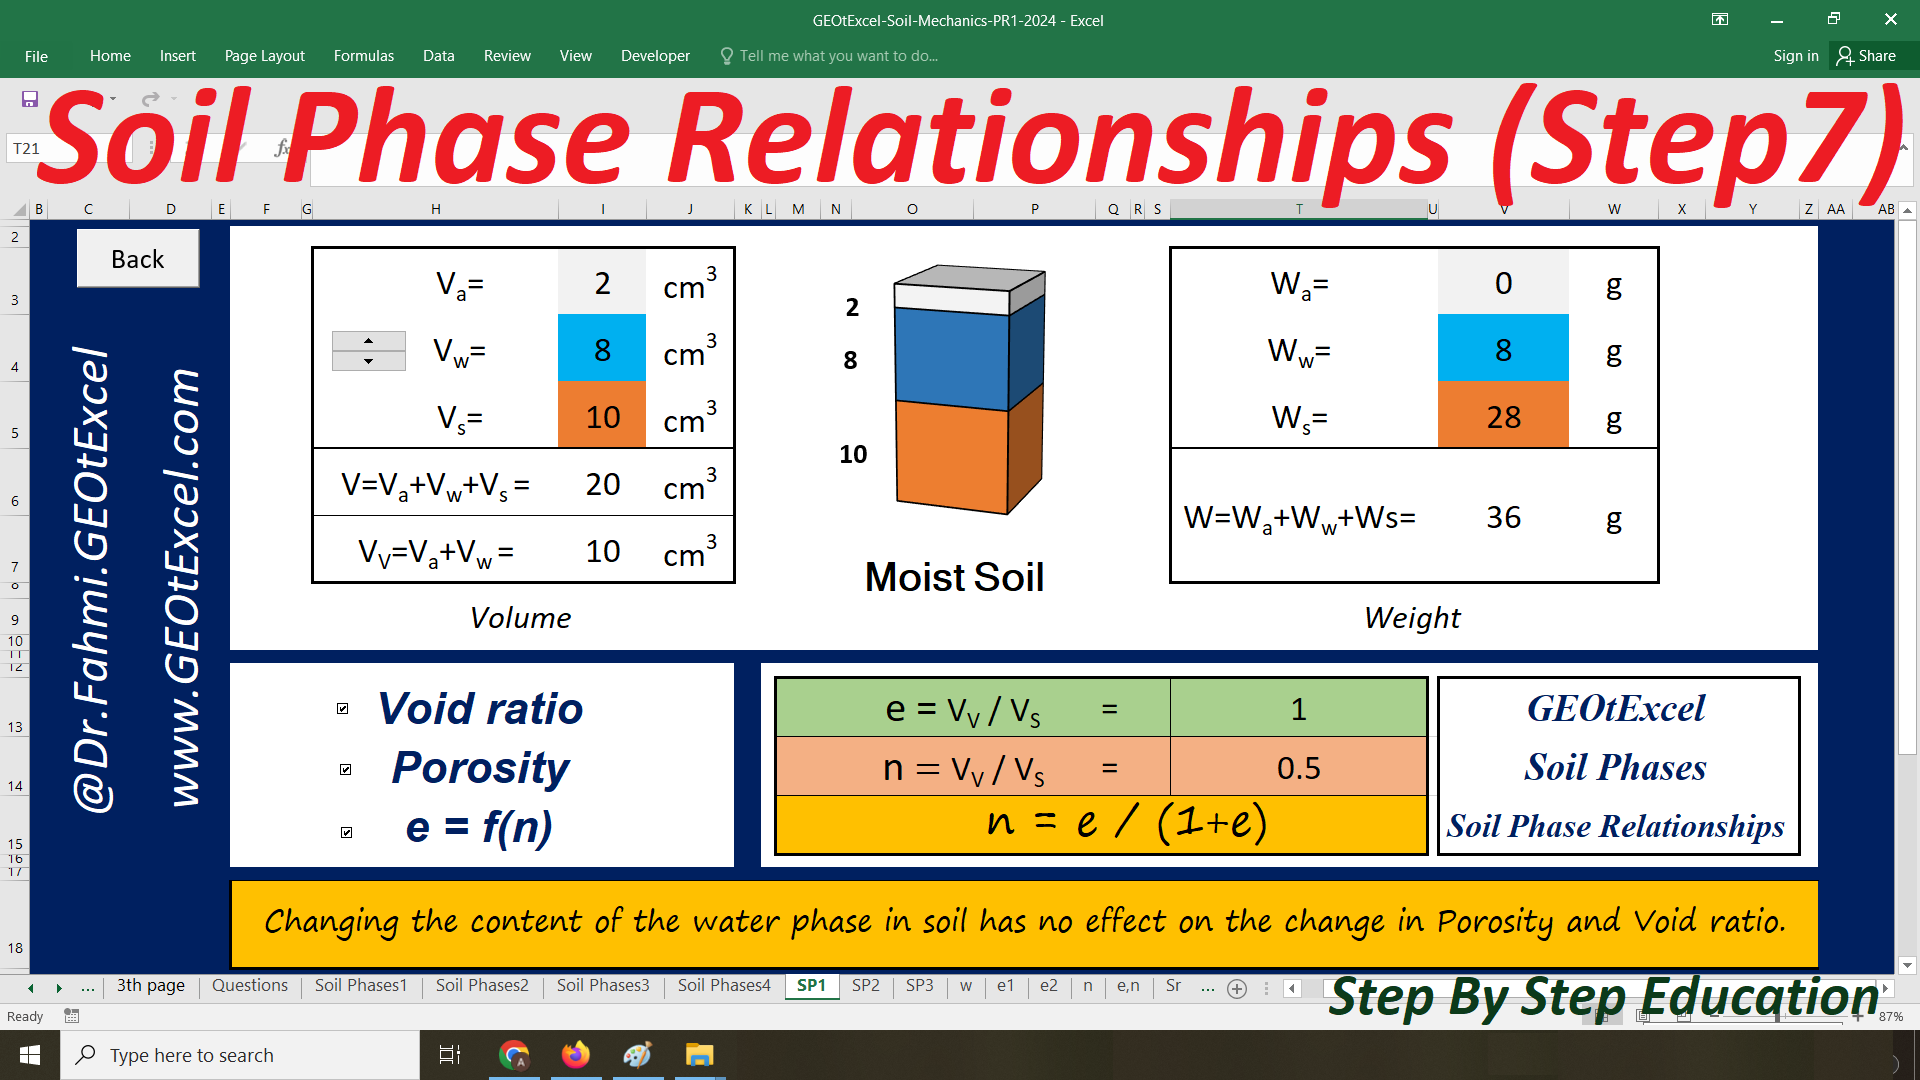
The void ratio represents the proportion of void volume to solid volume
The porosity represents the proportion of void volume to total volume
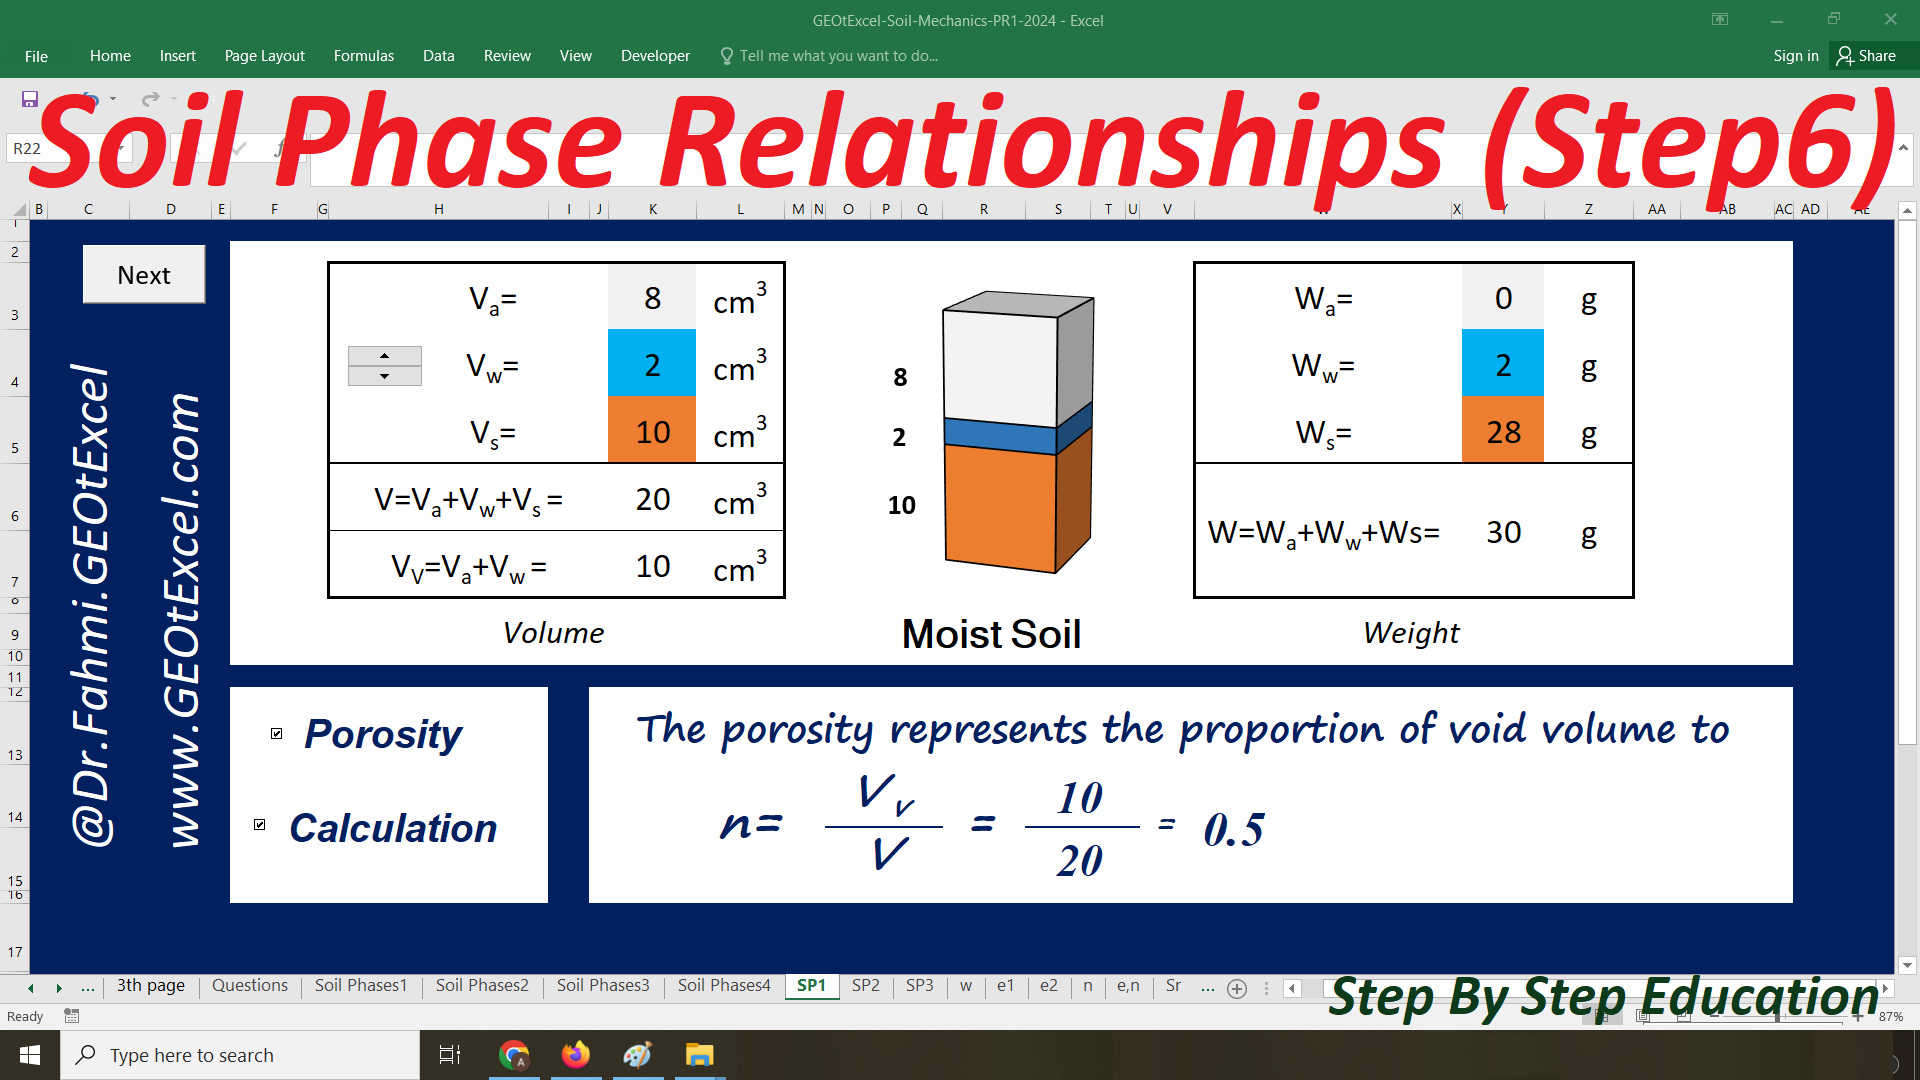
The porosity represents the proportion of void volume to total volume
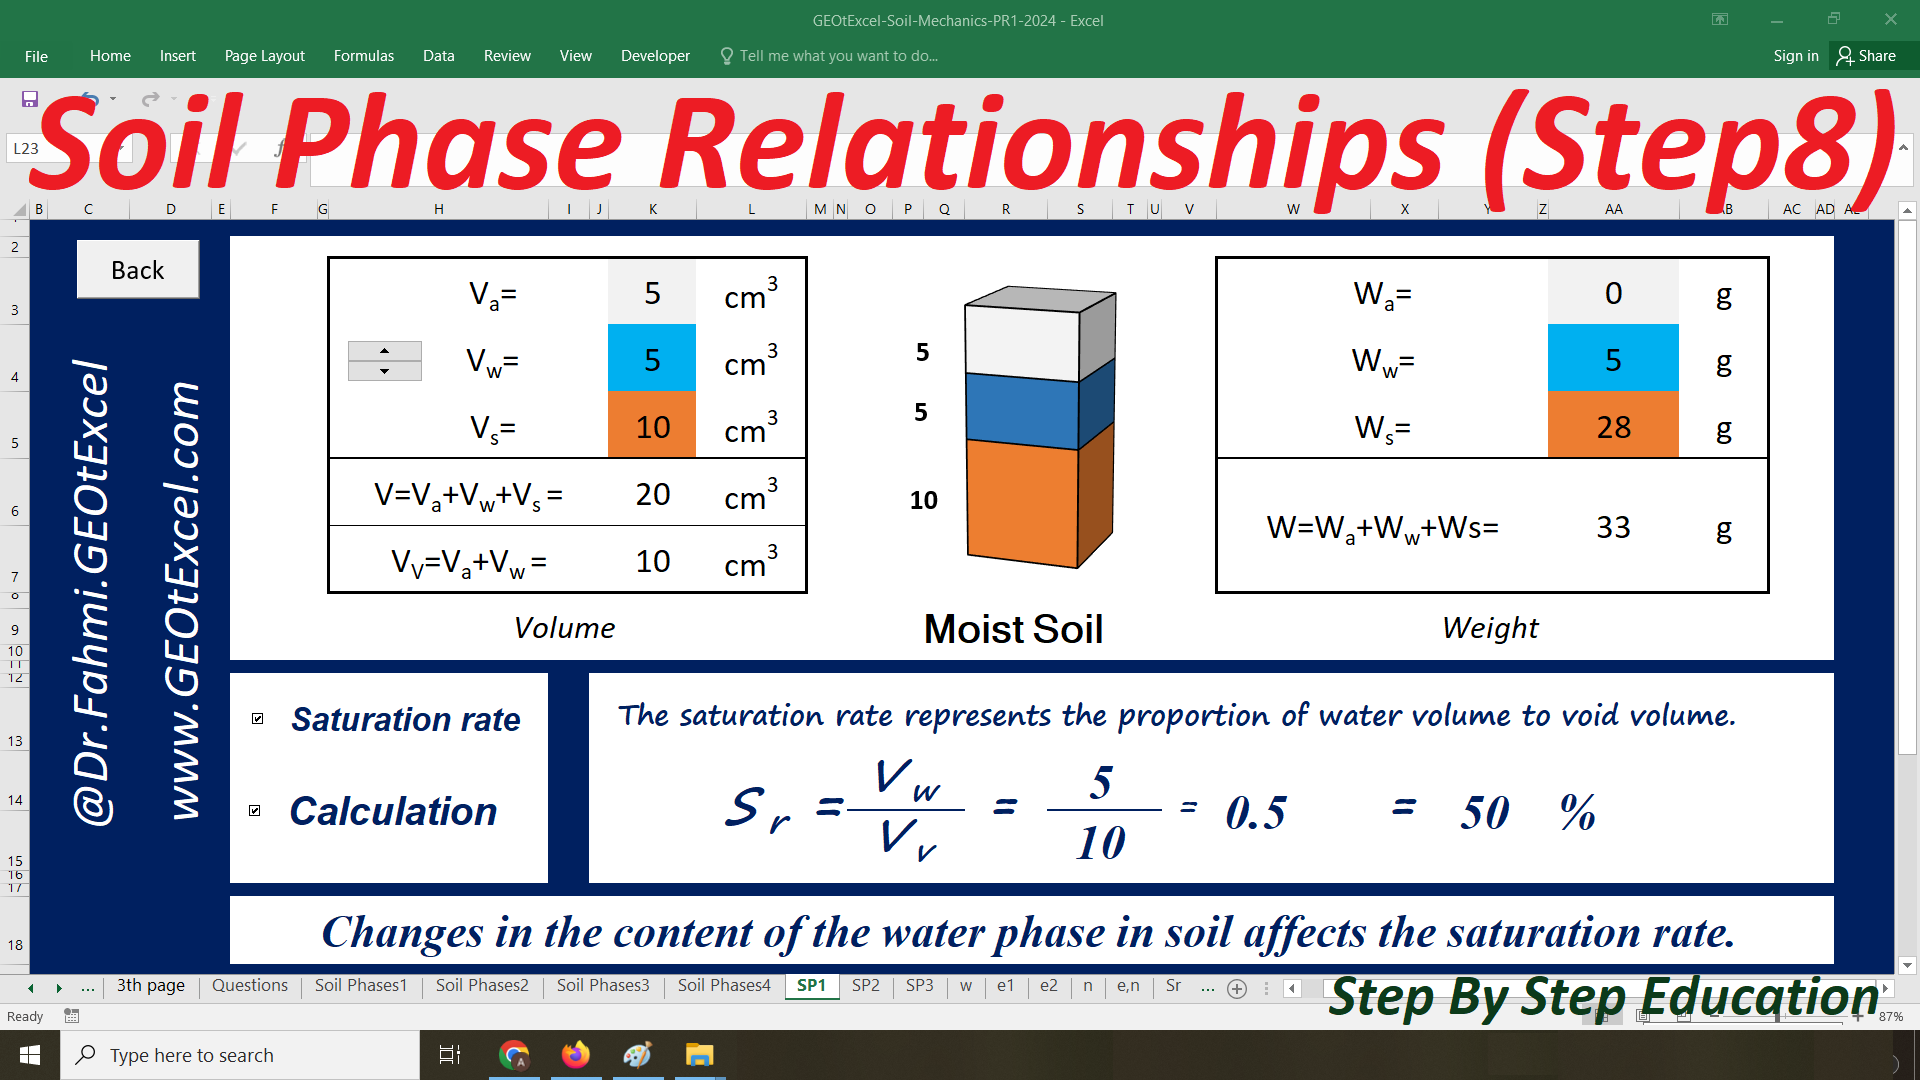
The saturation rate represents the proportion of water volume to void volume
The air content represents the proportion of air volume to void volume
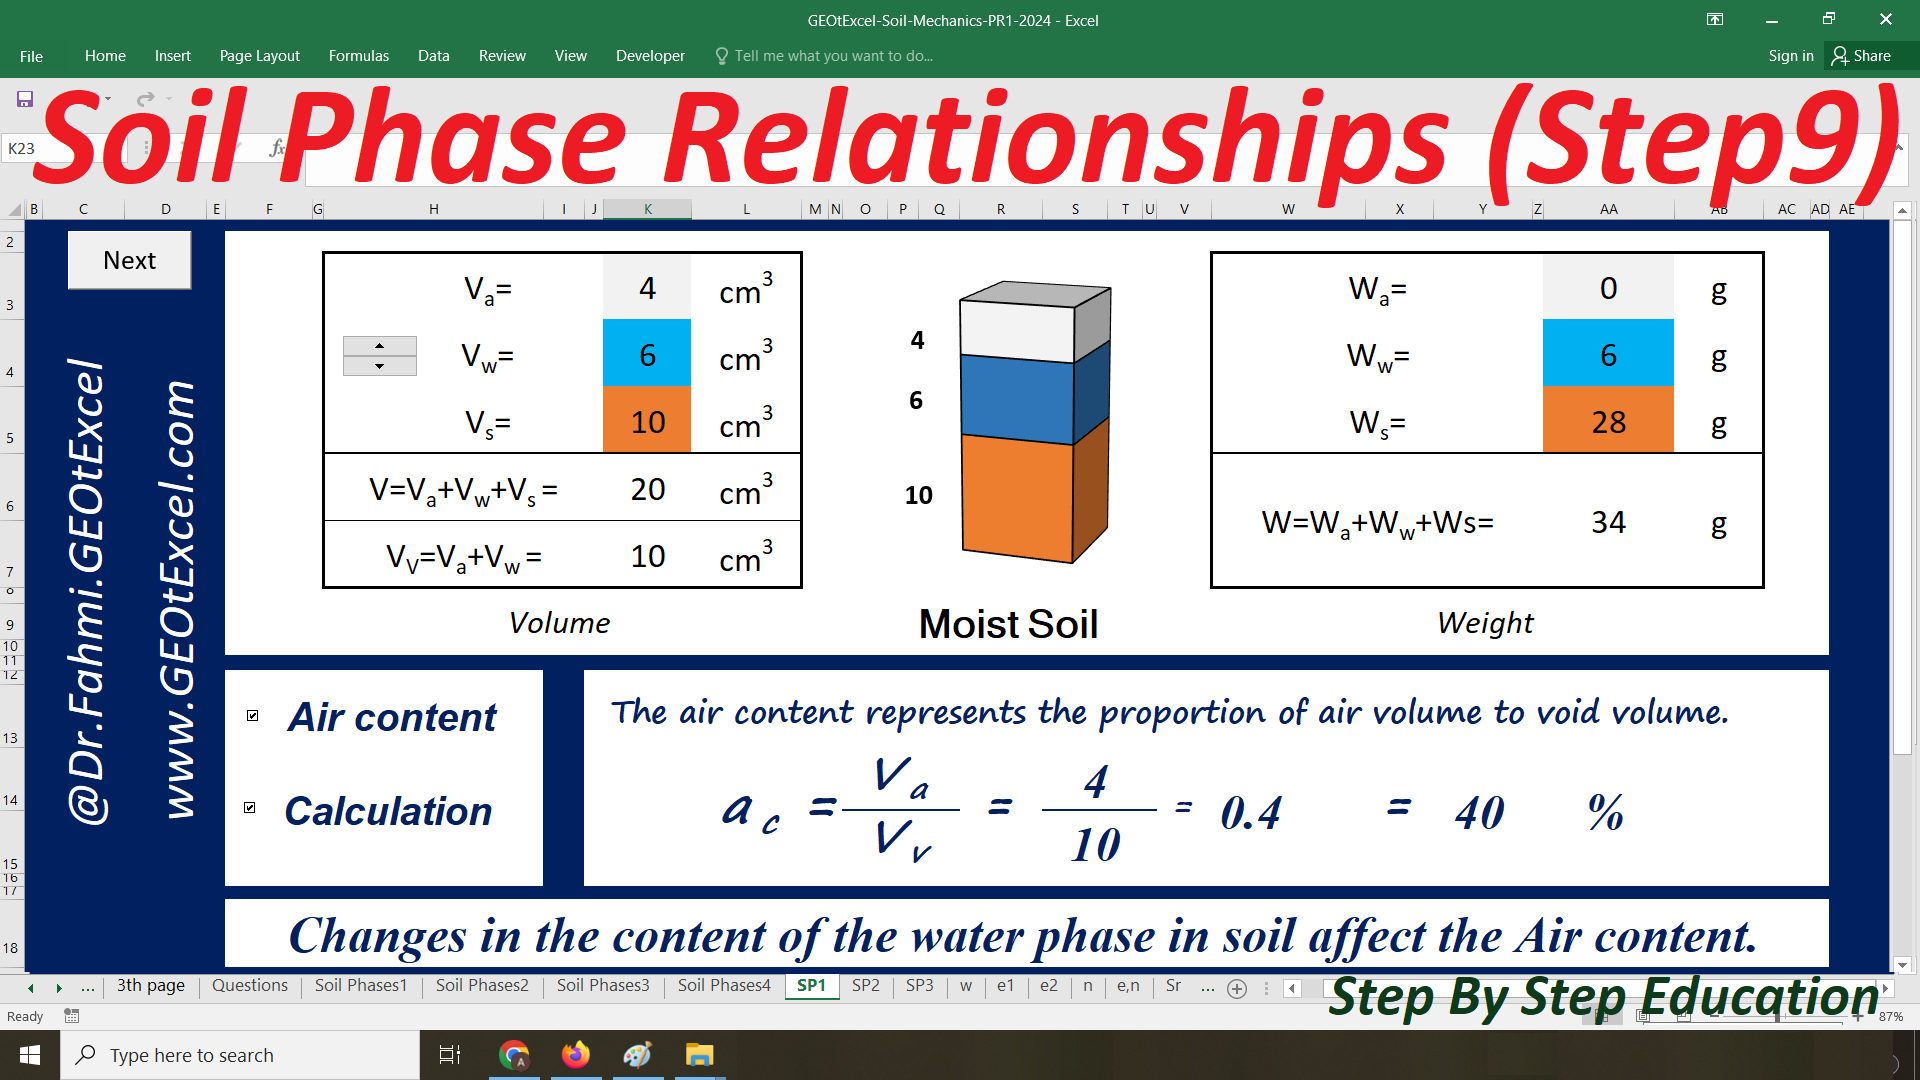
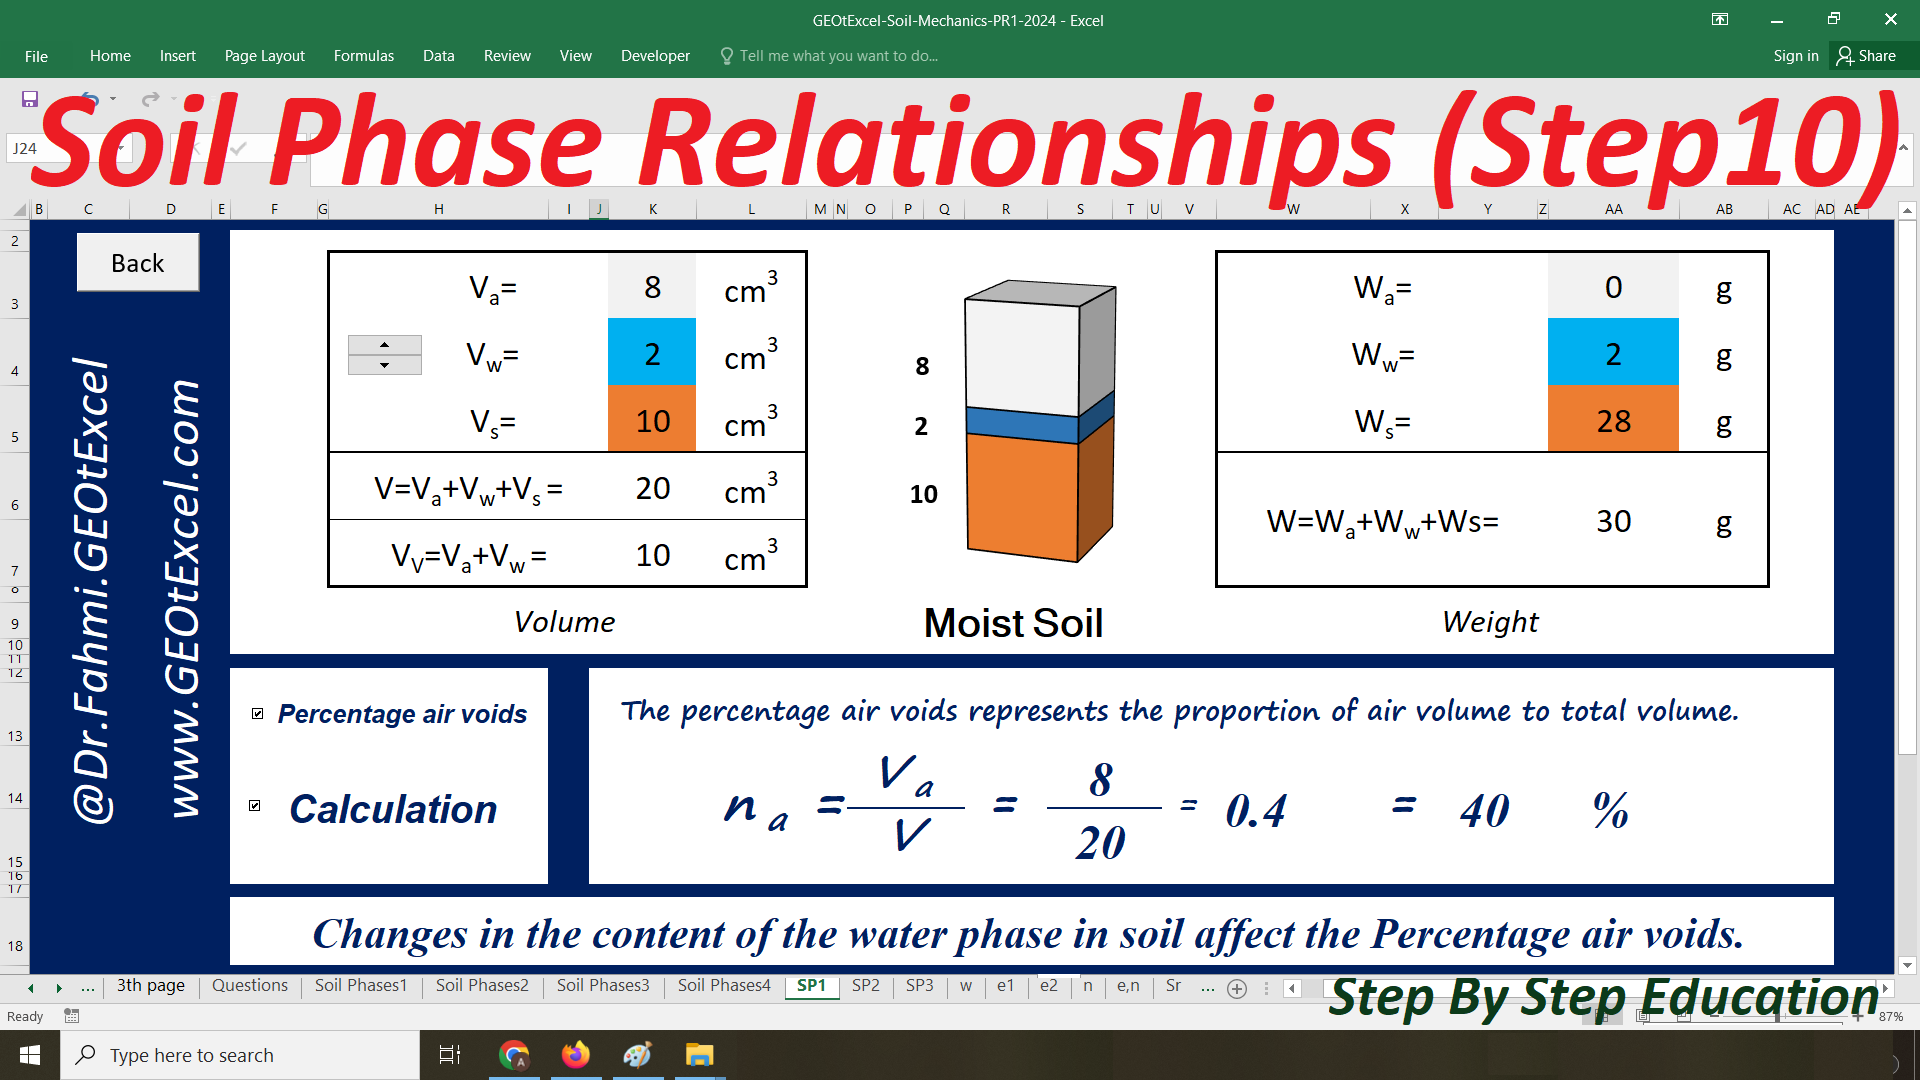
The percentage air voids represents the proportion of air volume to total volume
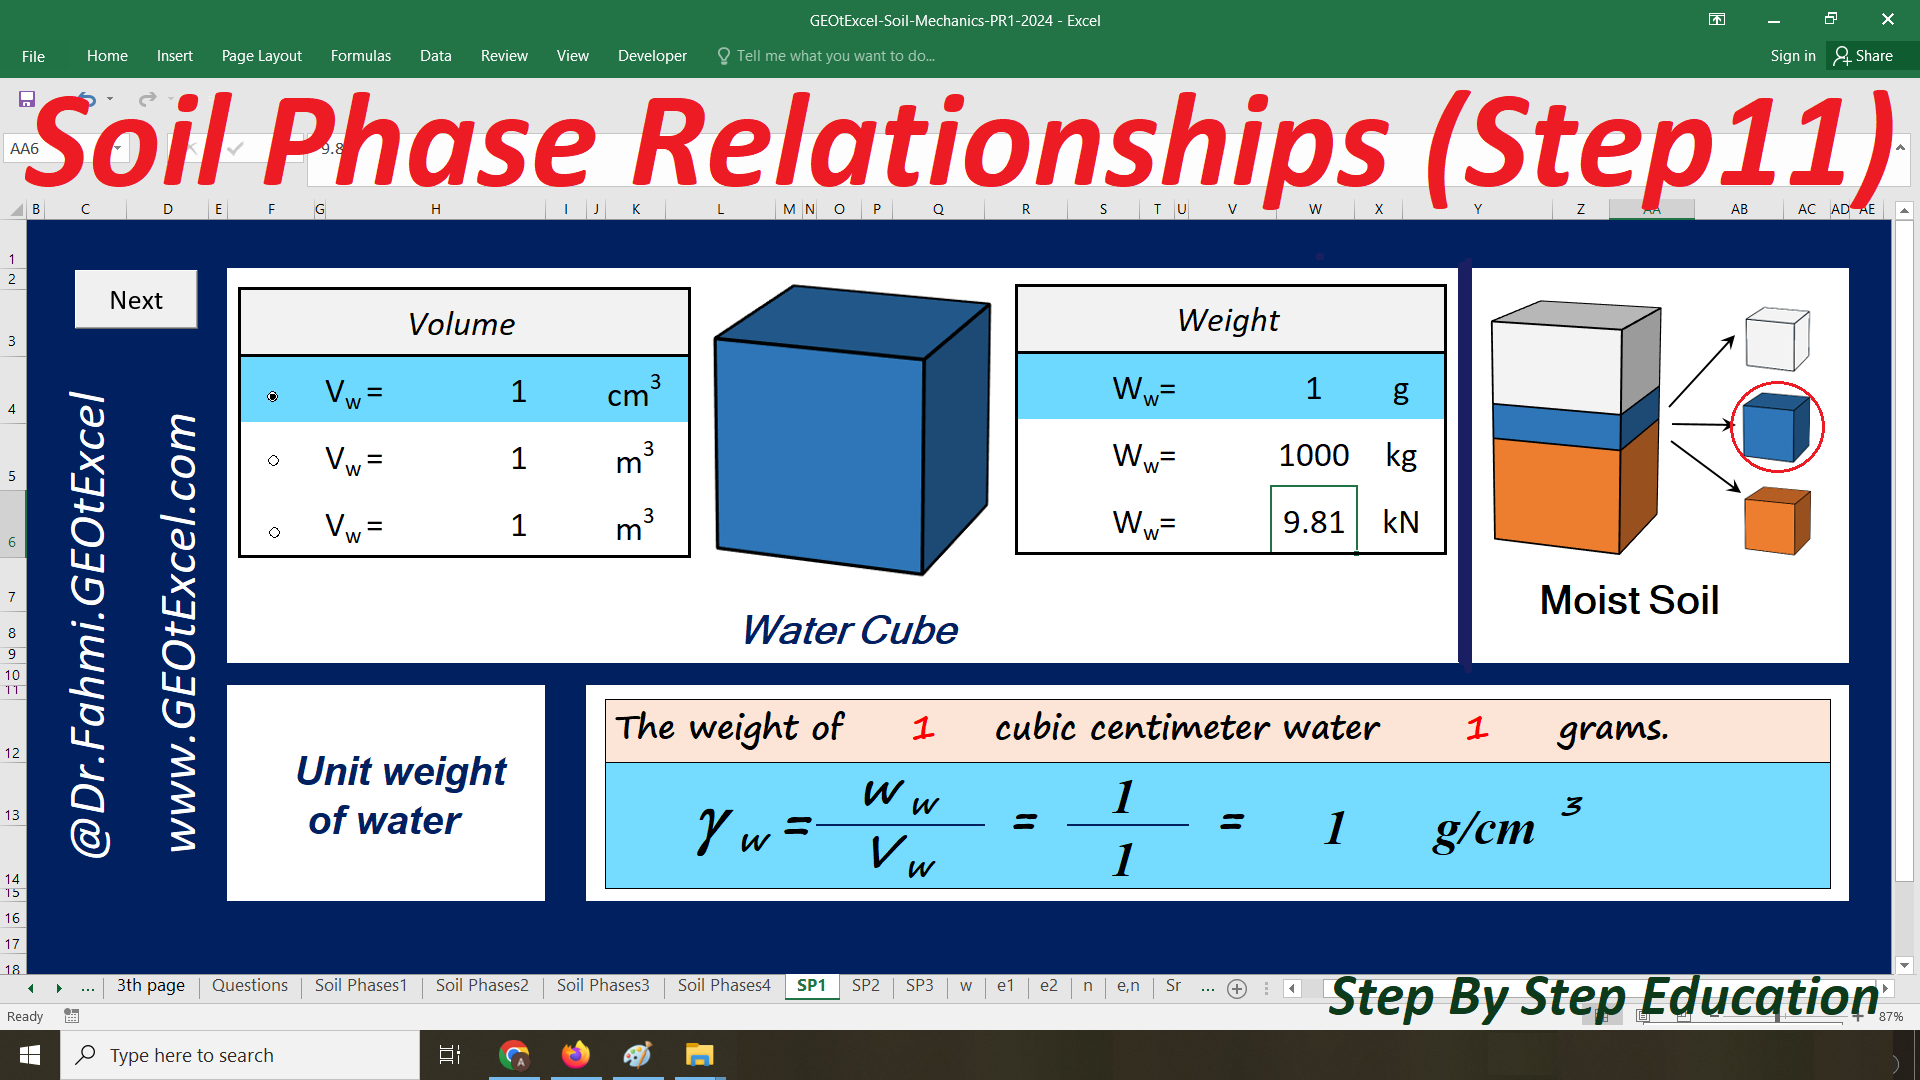
The weight of 1 cubic centimeter of water is 1 gram
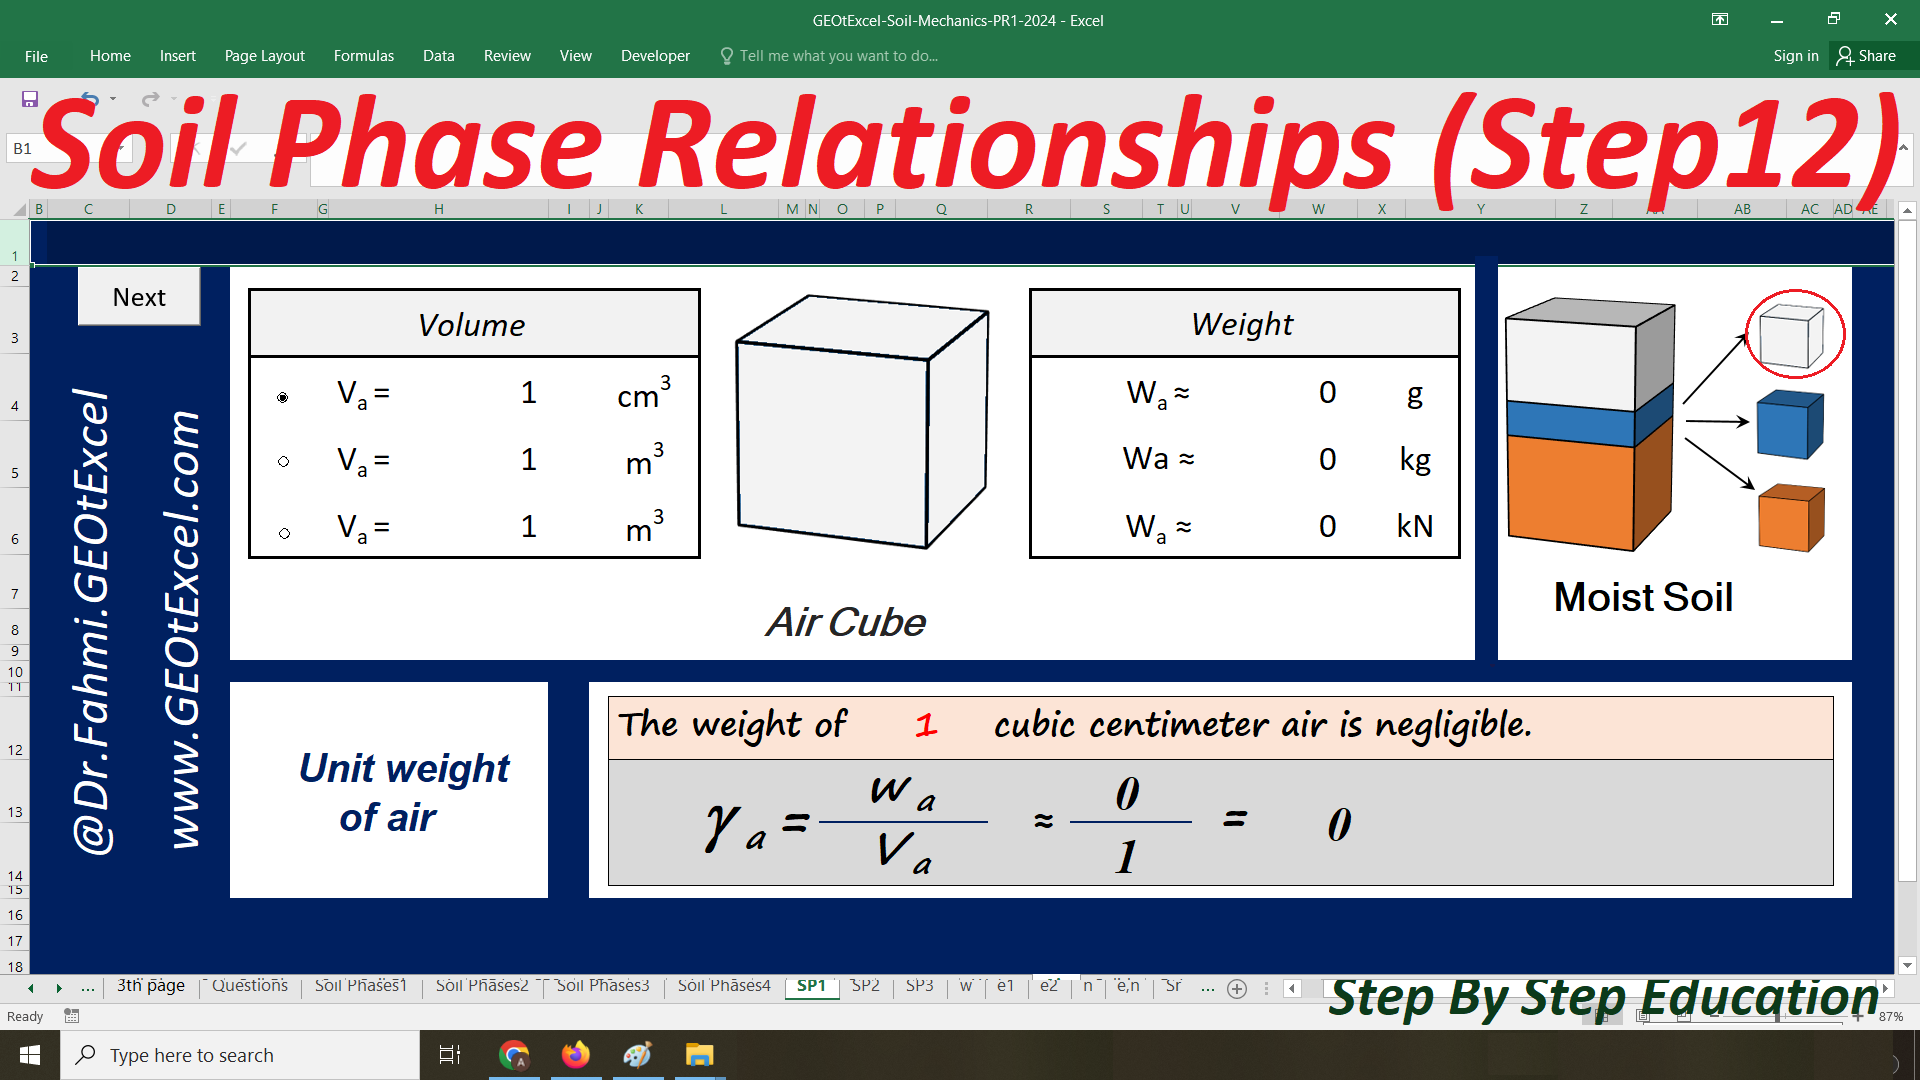
The weight of 1 cubic centimeter of air is negligible
The weight of 1 cubic centimeter of the clay is 2.72 grams (in this example)
Specific Gravity or Relative density of soil solids
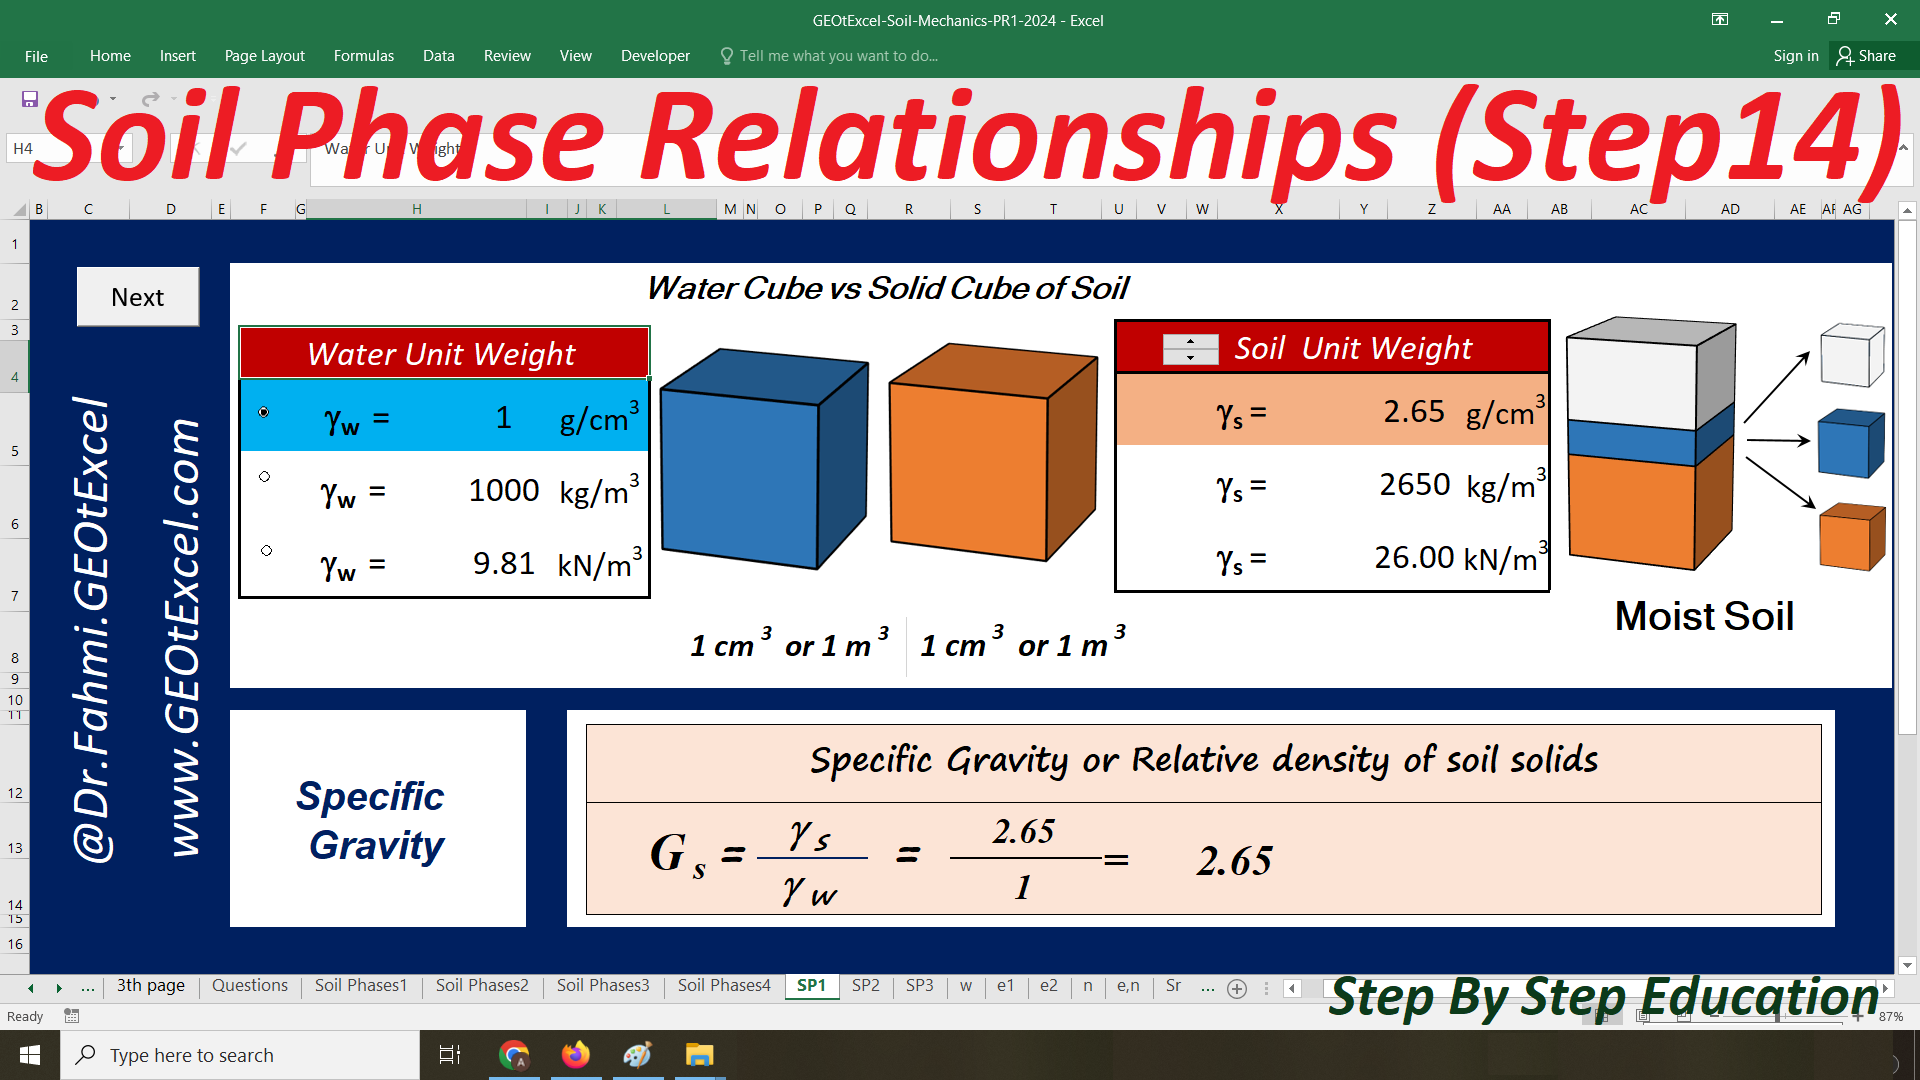
Specific Gravity or Relative density of soil solids
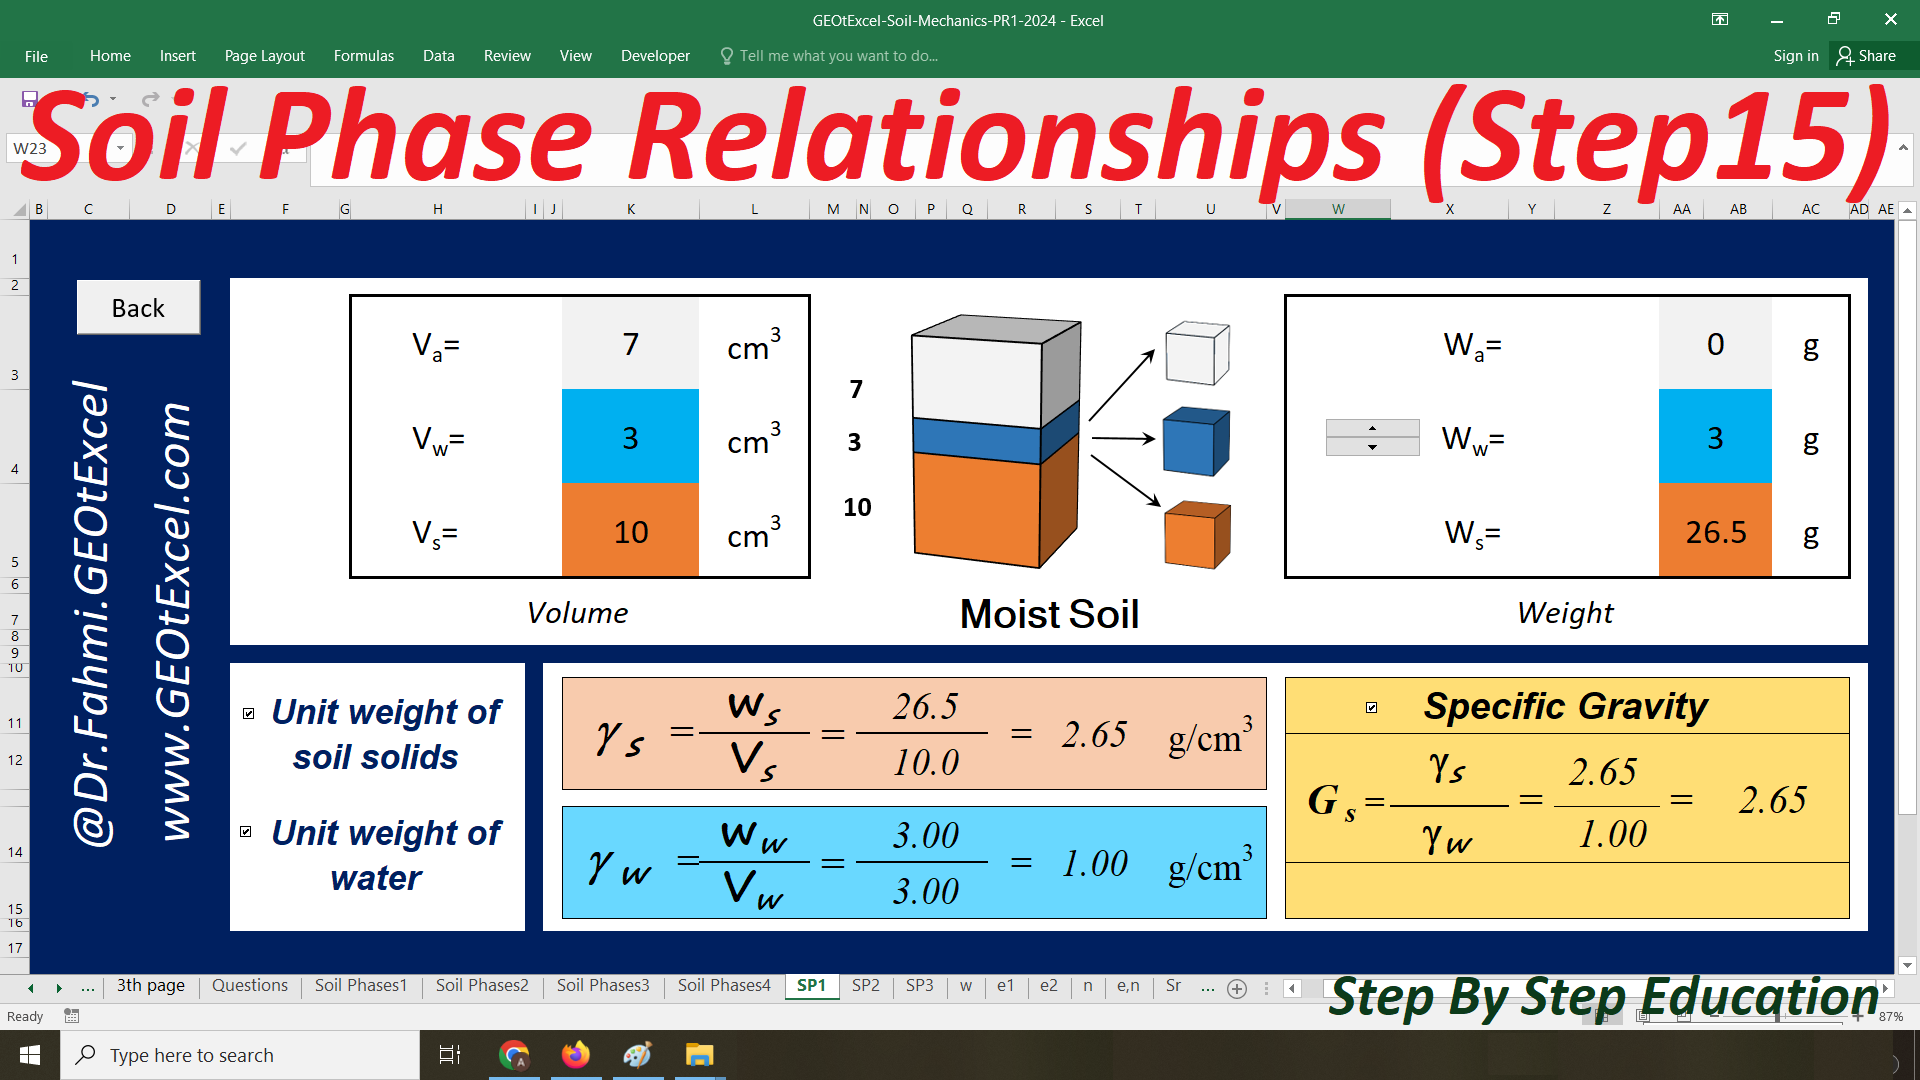
Phase 1: Unit weight of air
Phase 2: Unit weight of water
Phase 3: Unit weight of soil solids
3-Phase Soil: Unit weight
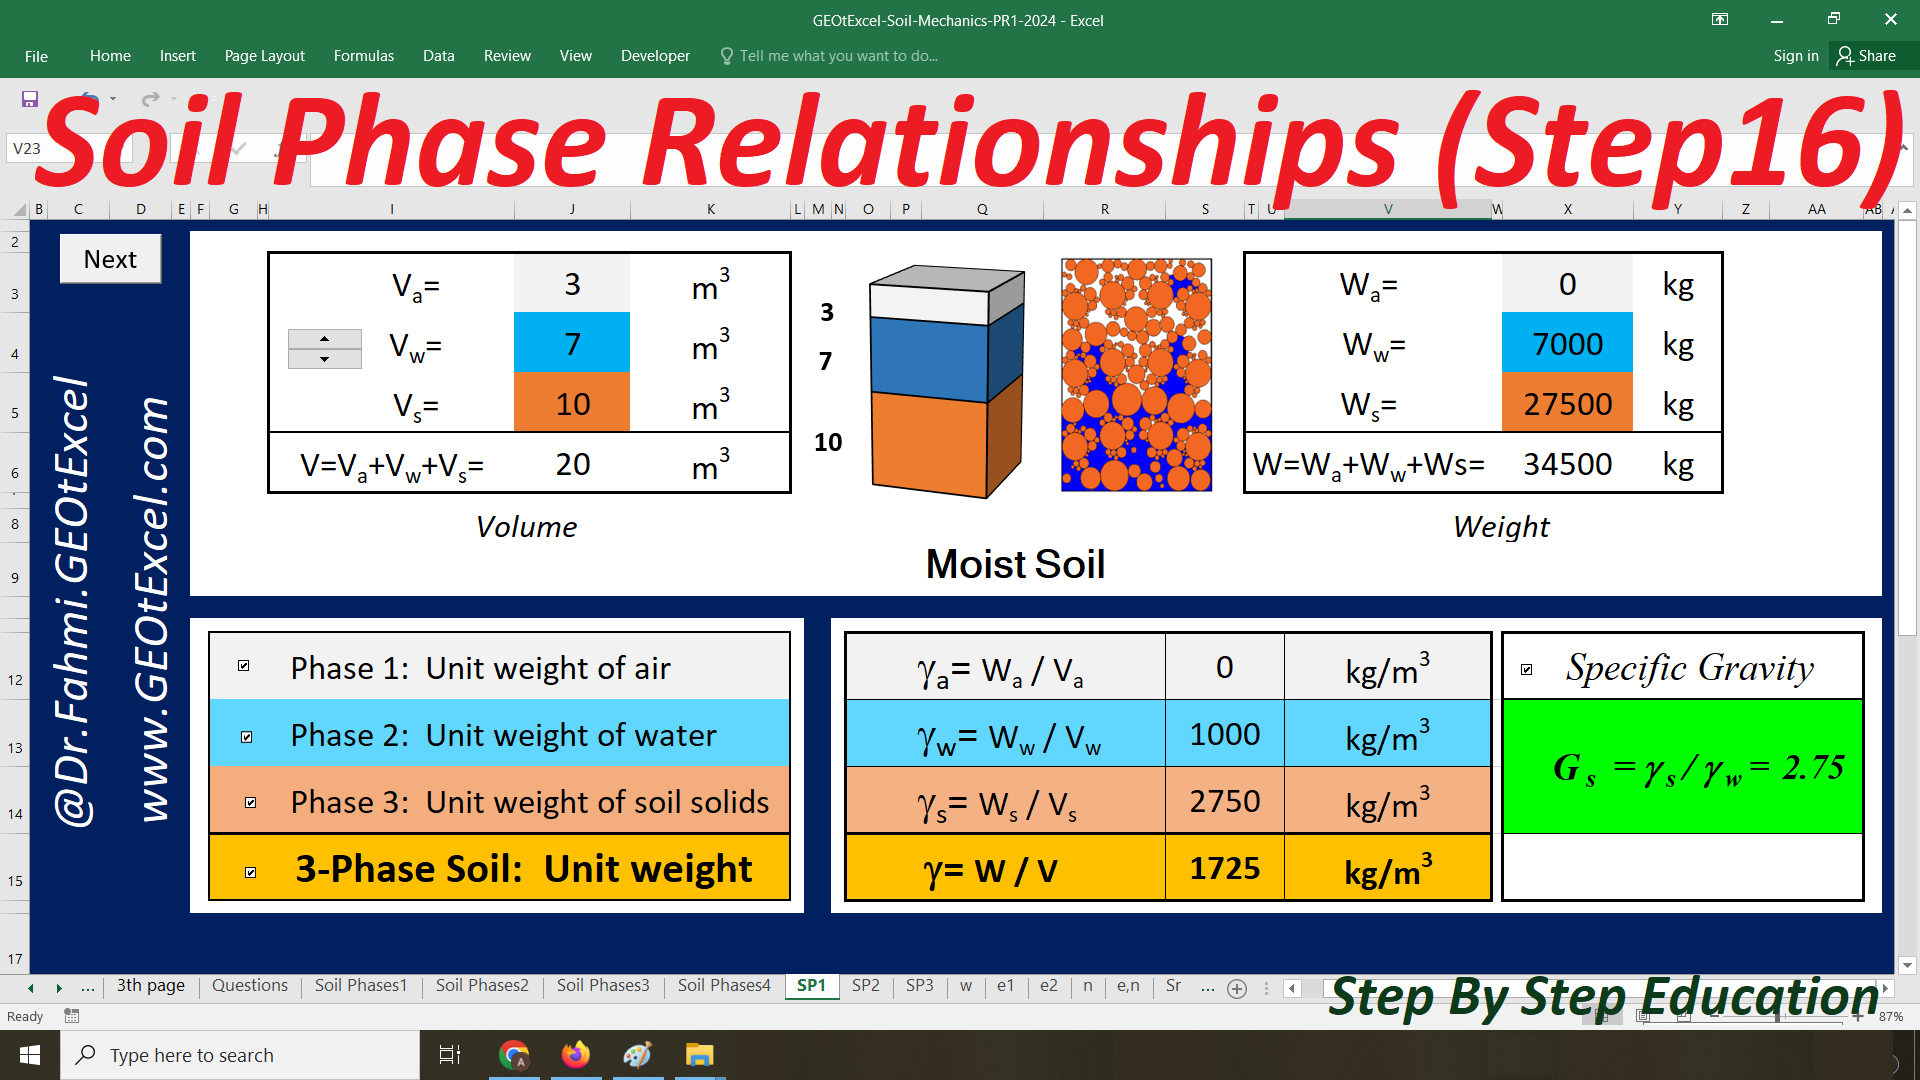
Dry Unit Weight
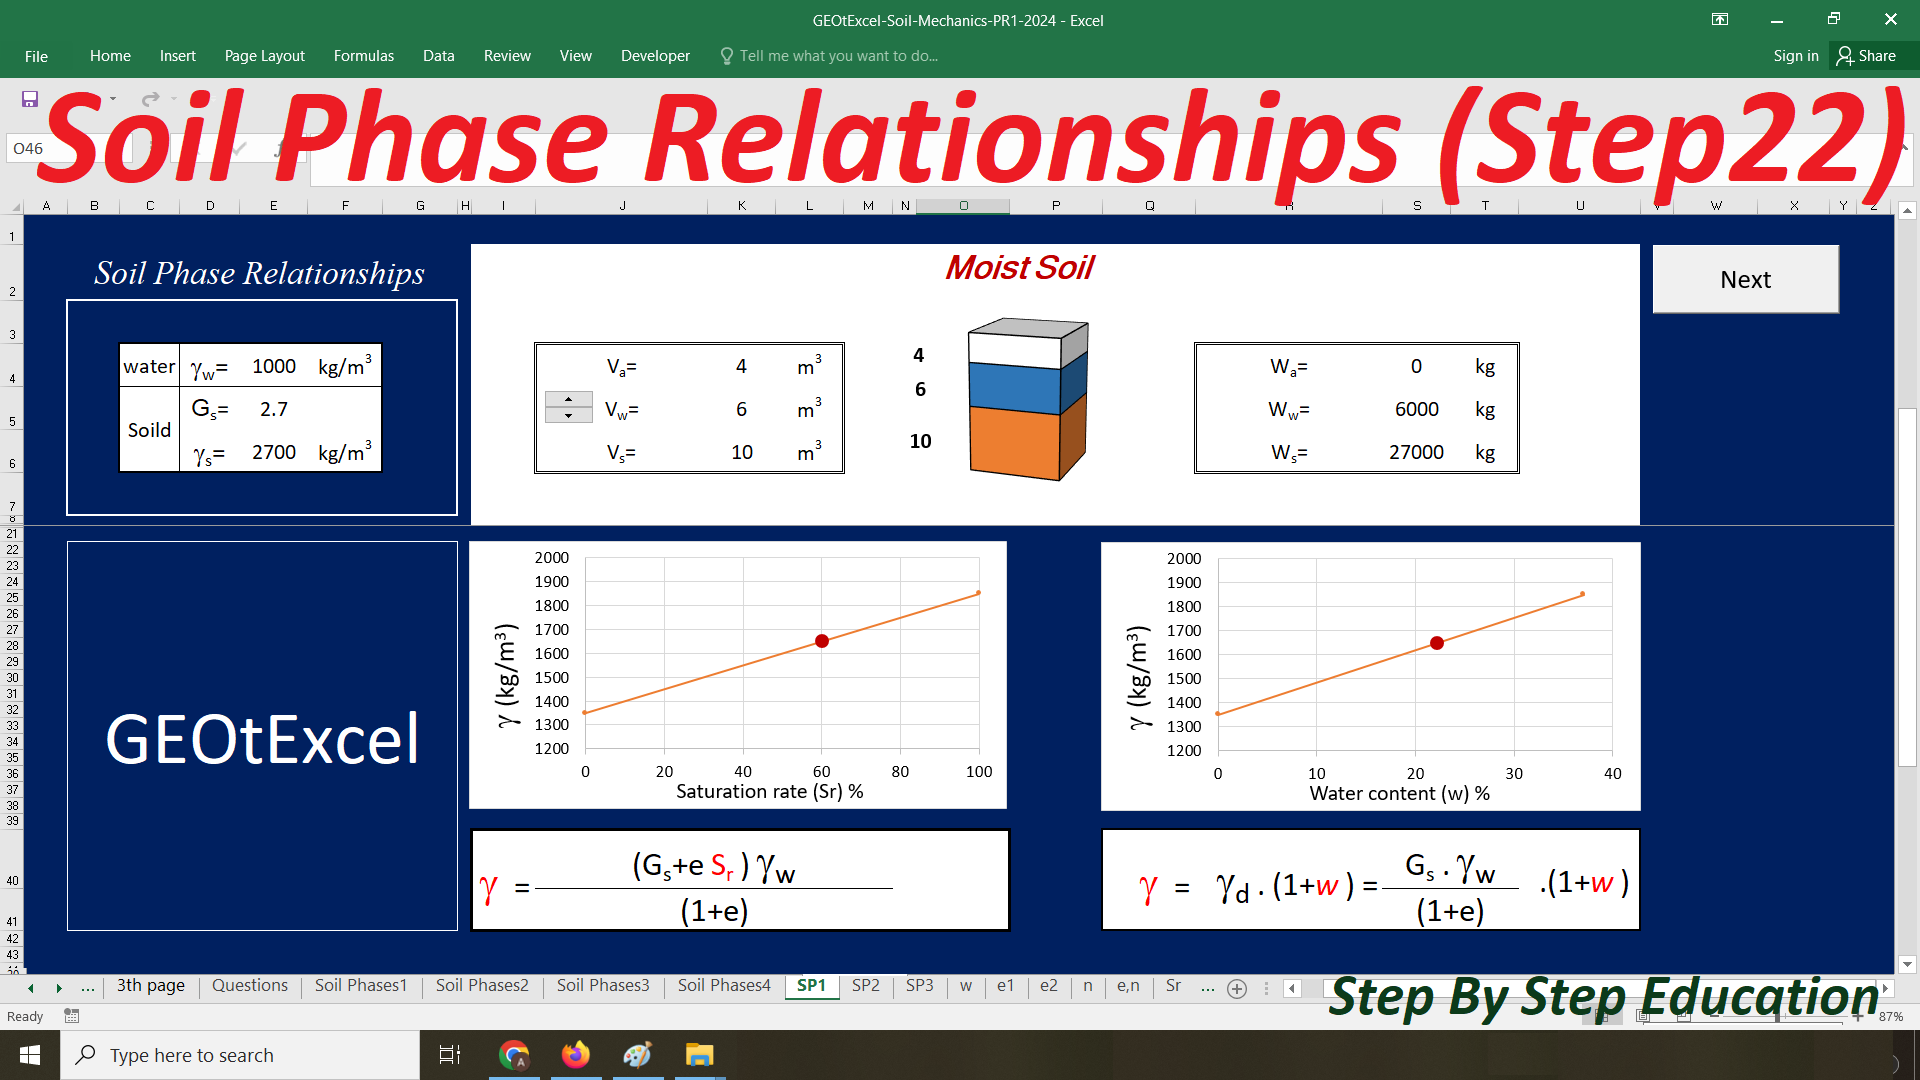
Moisture Unit Weight
Saturated Unit Weight
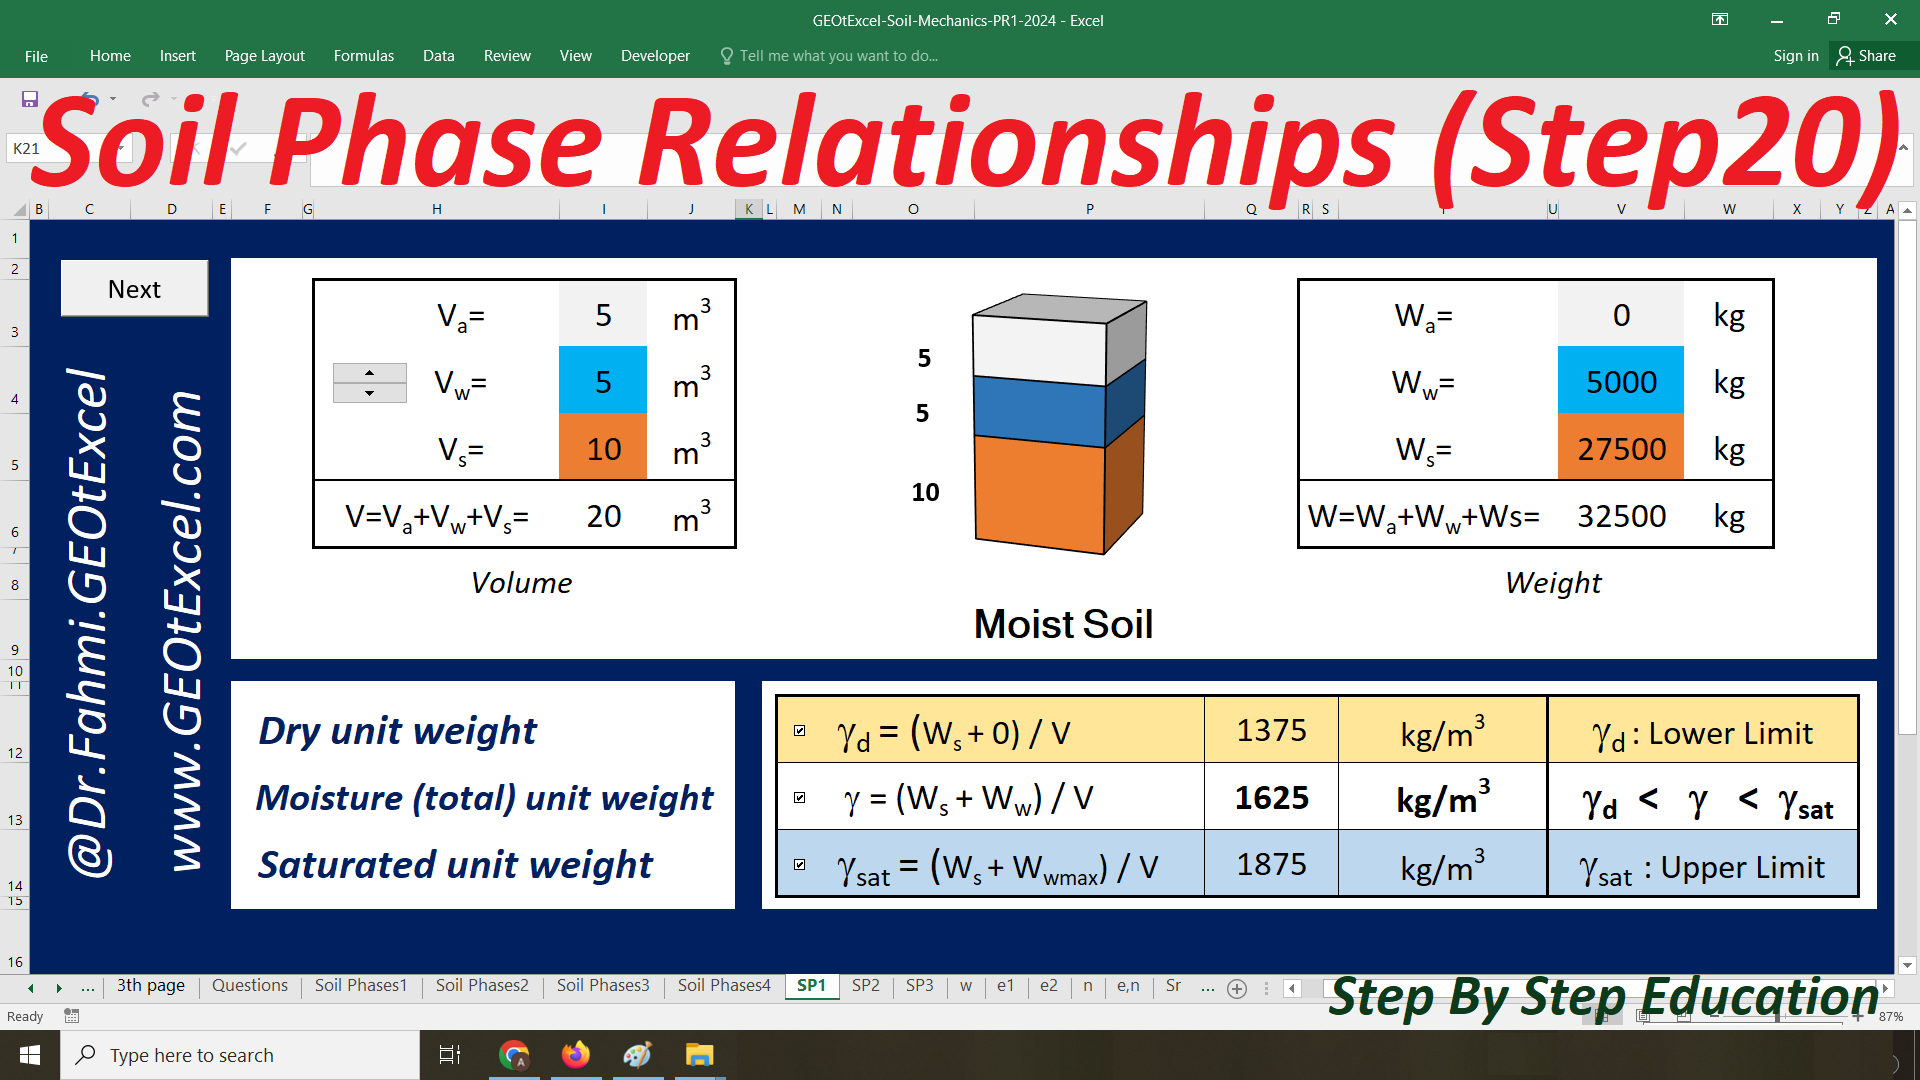
Dry unit weight
Moisture (total) unit weight
Saturated unit weight
w.Gs=Sr.e
Dry unit weight & Moisture (total) unit weight Relationship
✅ Instagram Page Address:☑ https://www.instagram.com/academy.dr.fahmi
✅ Excel Spreadsheets for Soil Mechanics & Foundation Engineering
✅ Geotechnical Excel Programs & Lectures
https://www.youtube.com/@Dr.Fahmi.GEOtExcel
Designed by Dr. Ahmad Fahmi
Bearing Capacity Calculator
Calculating Bearing Capacity Using Excel Spreadsheets
Bearing Capacity Calculator
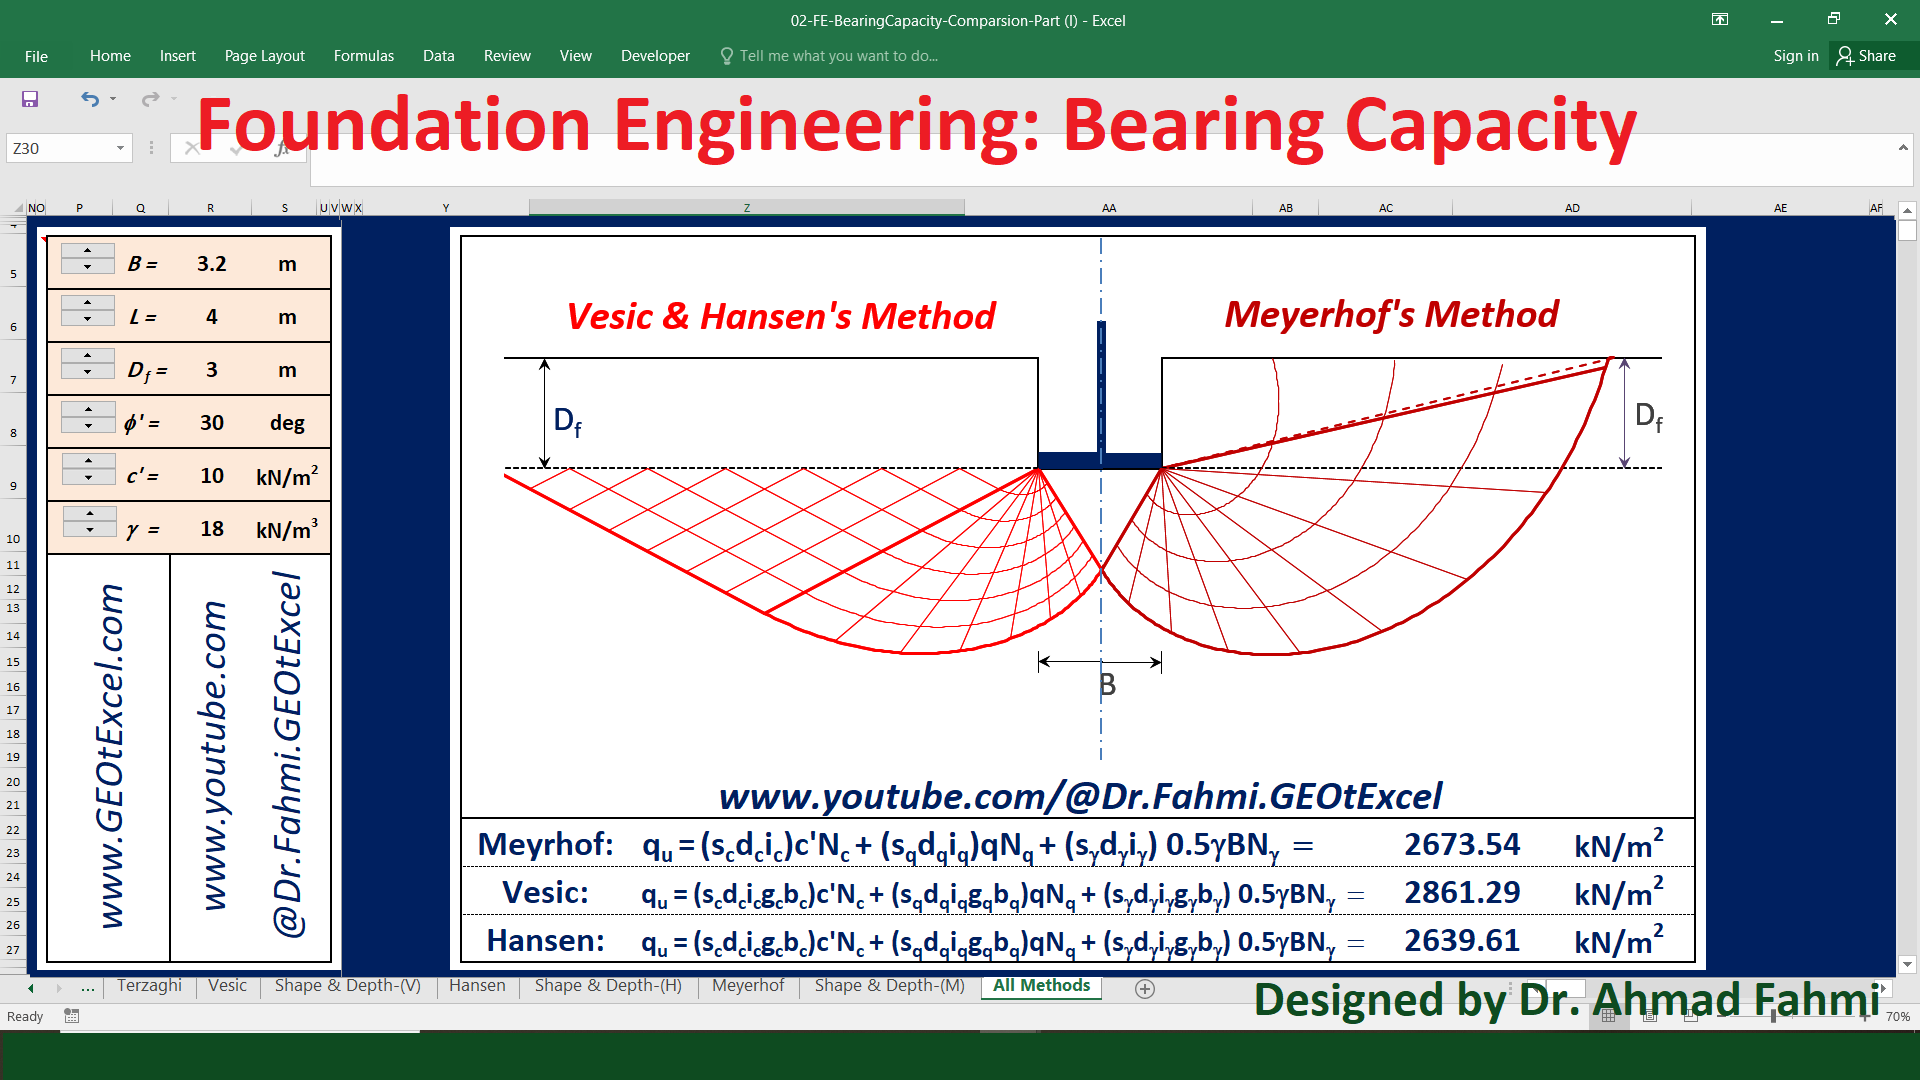
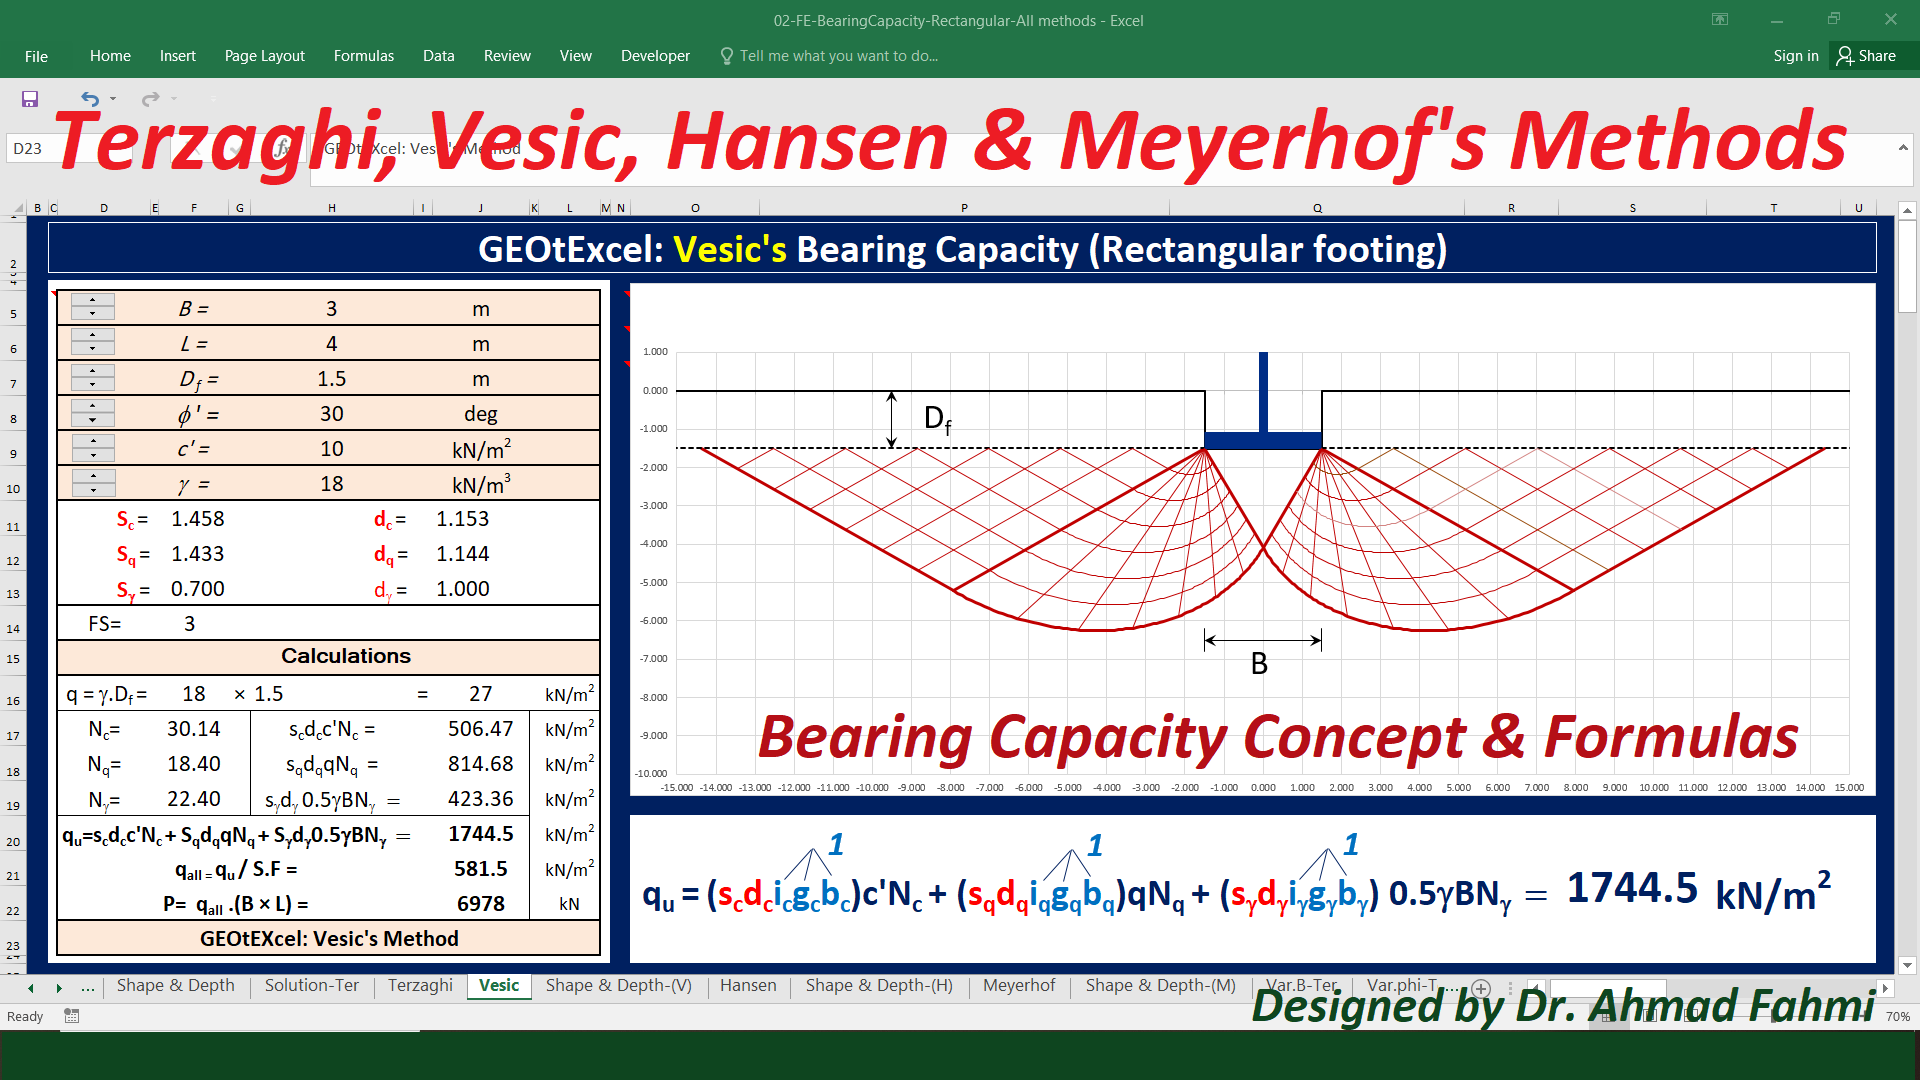
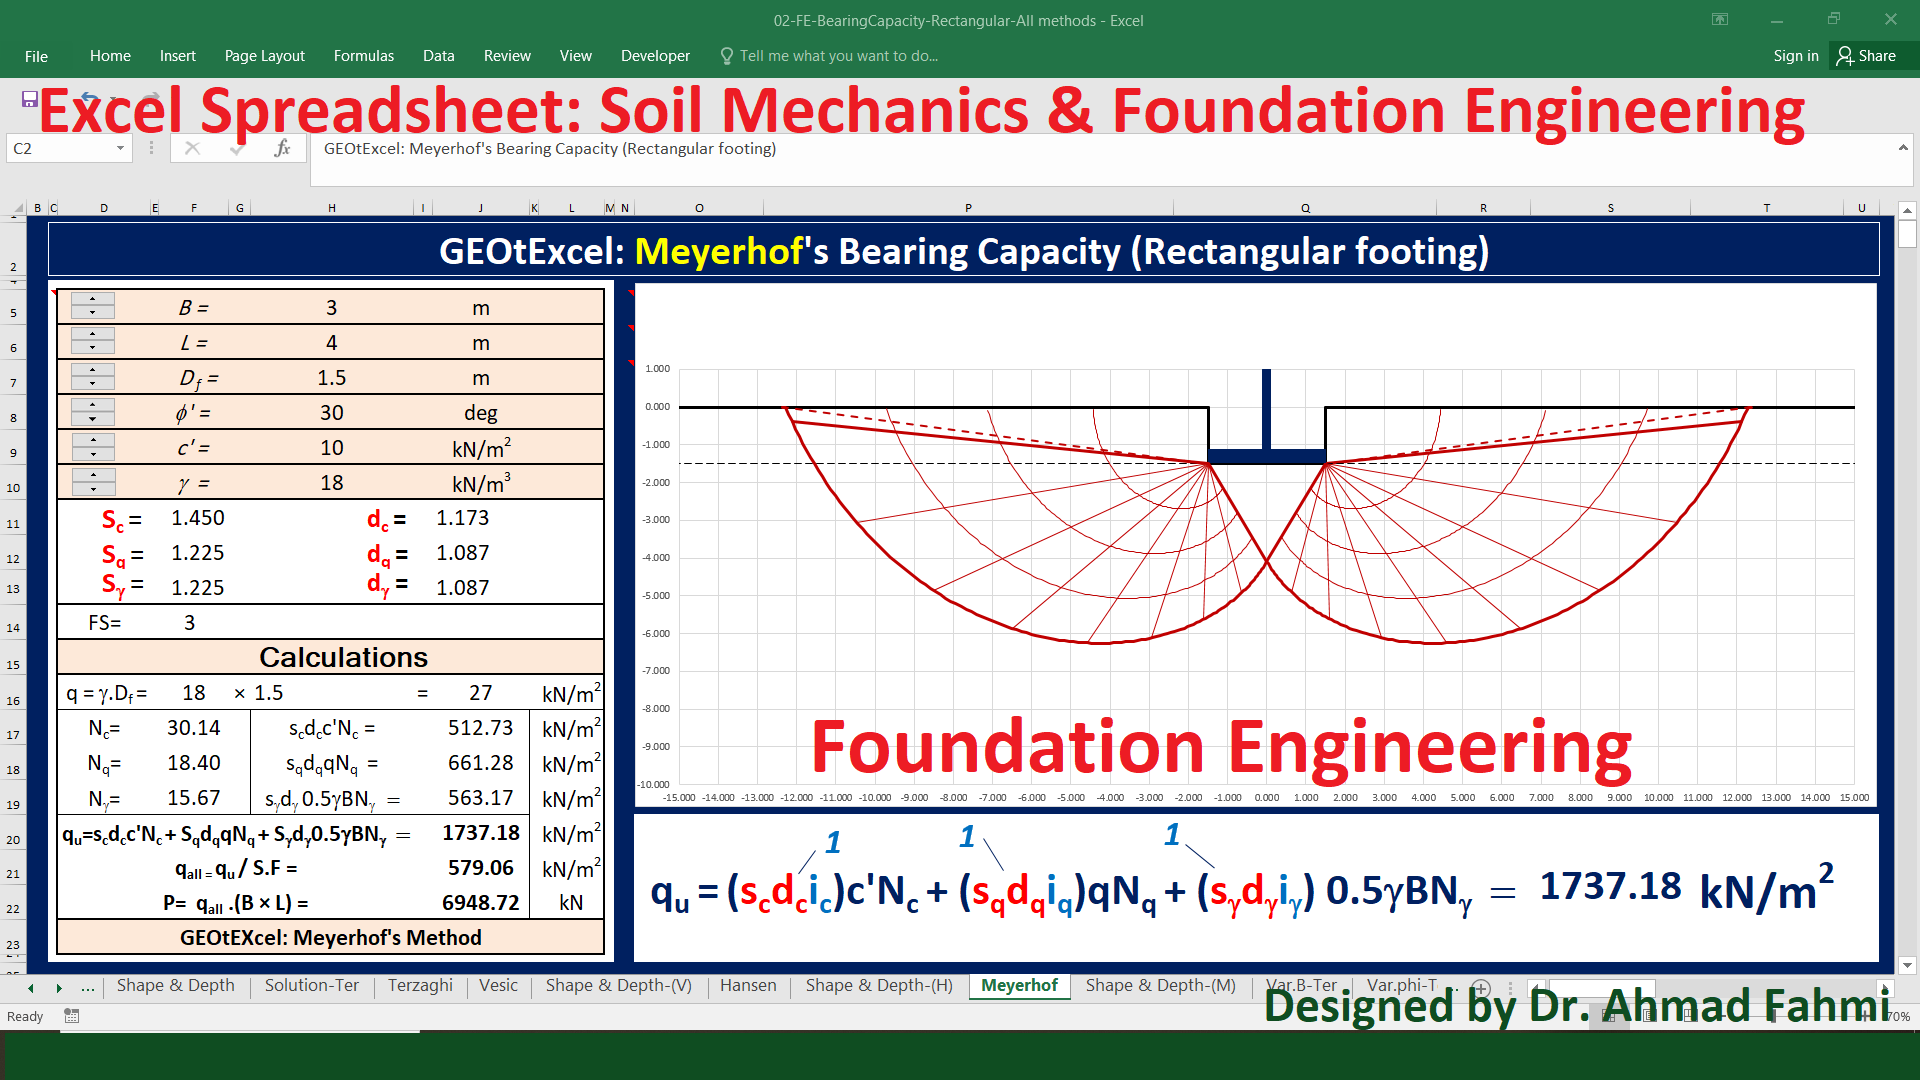
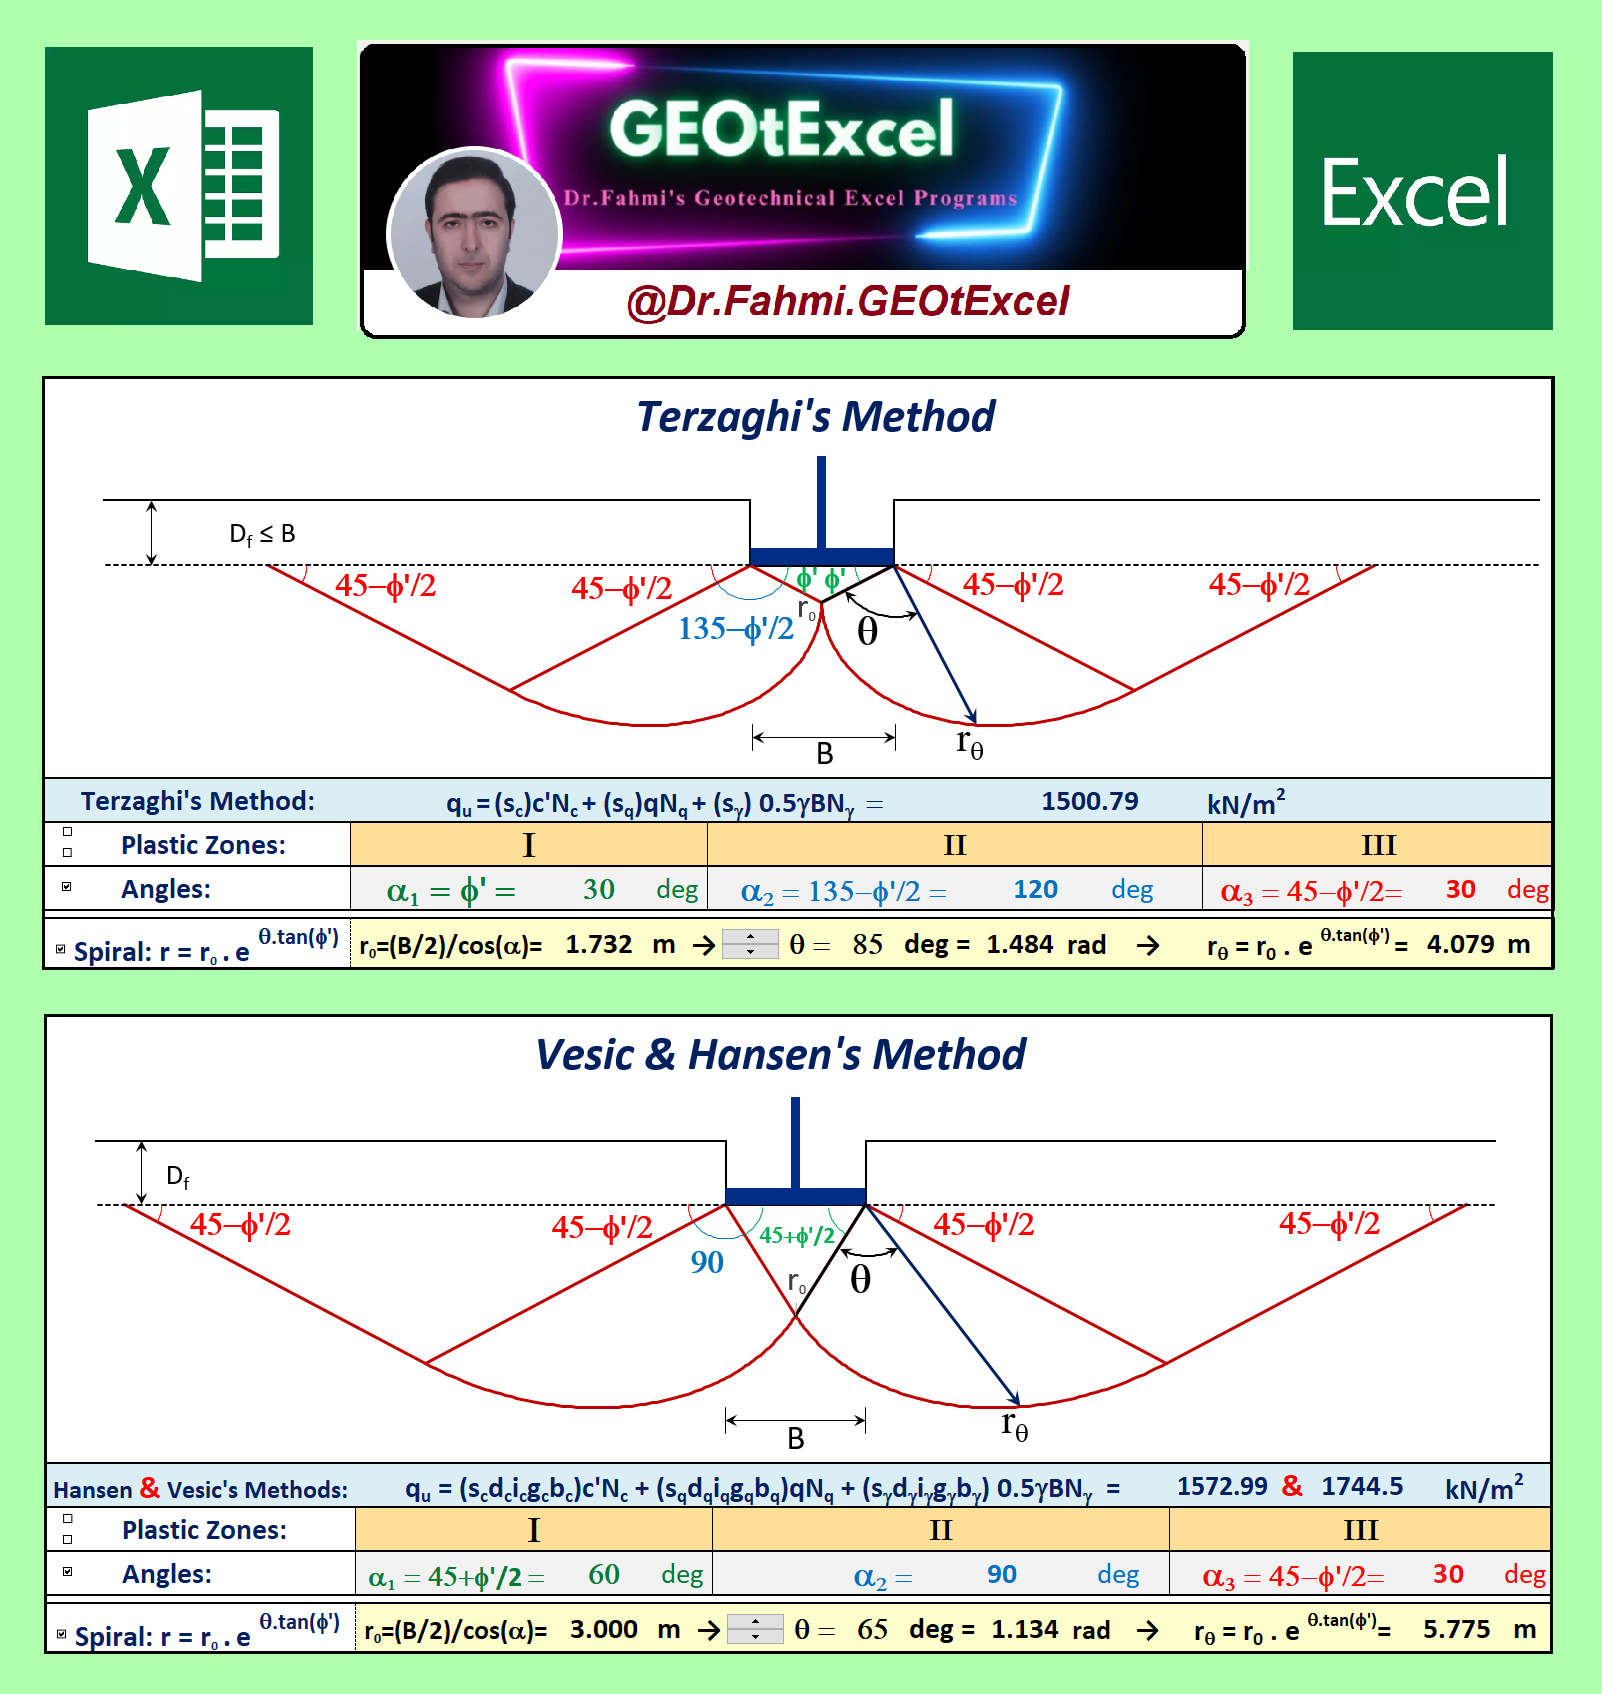
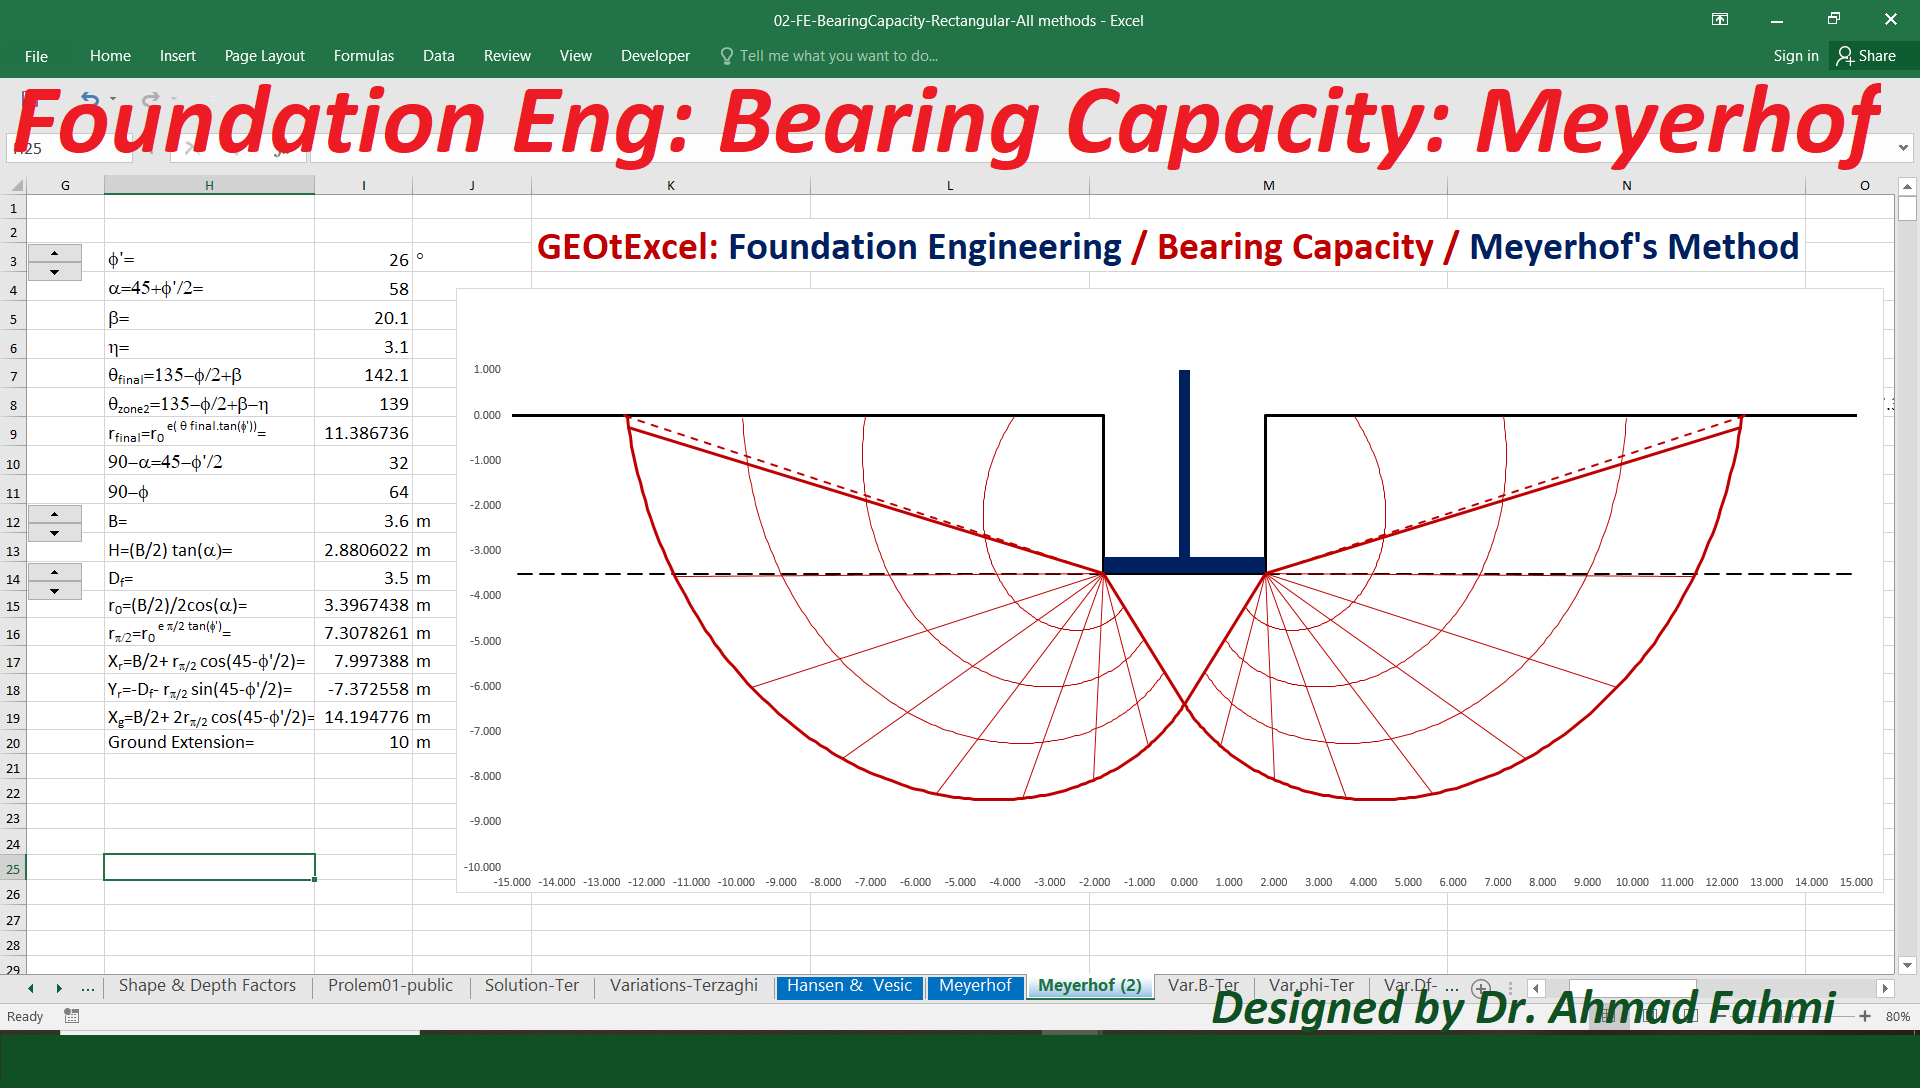
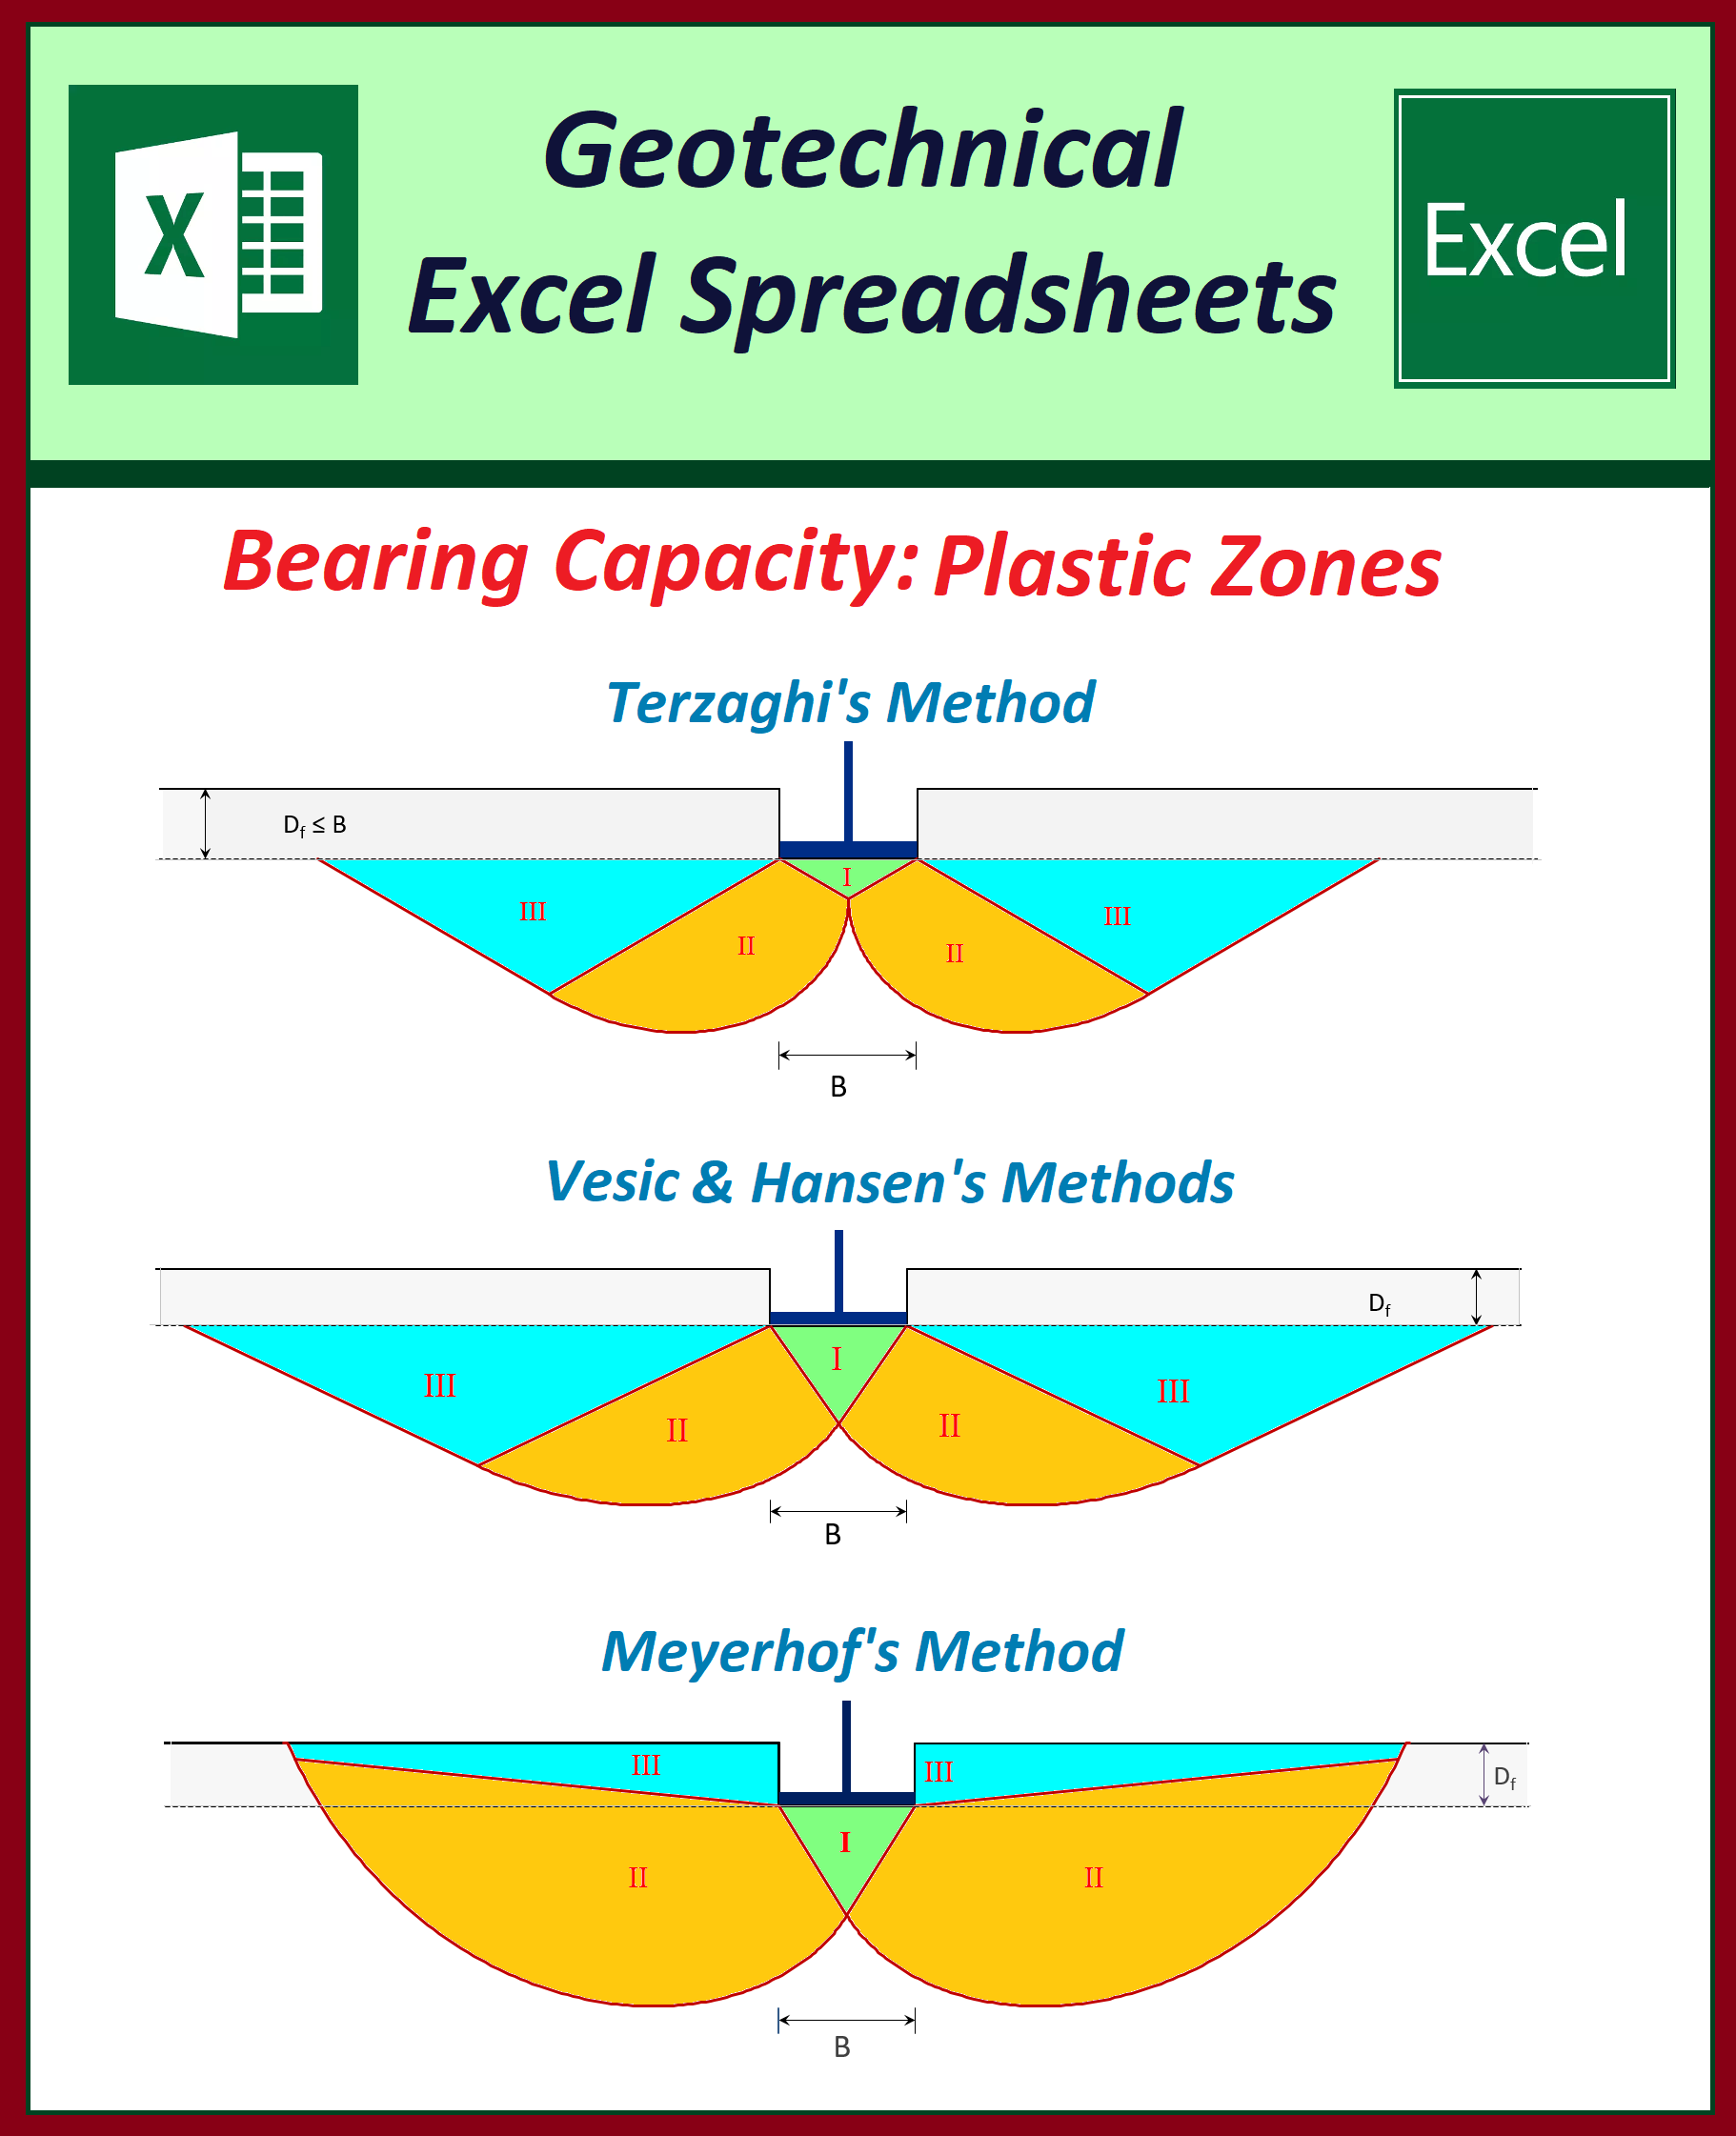
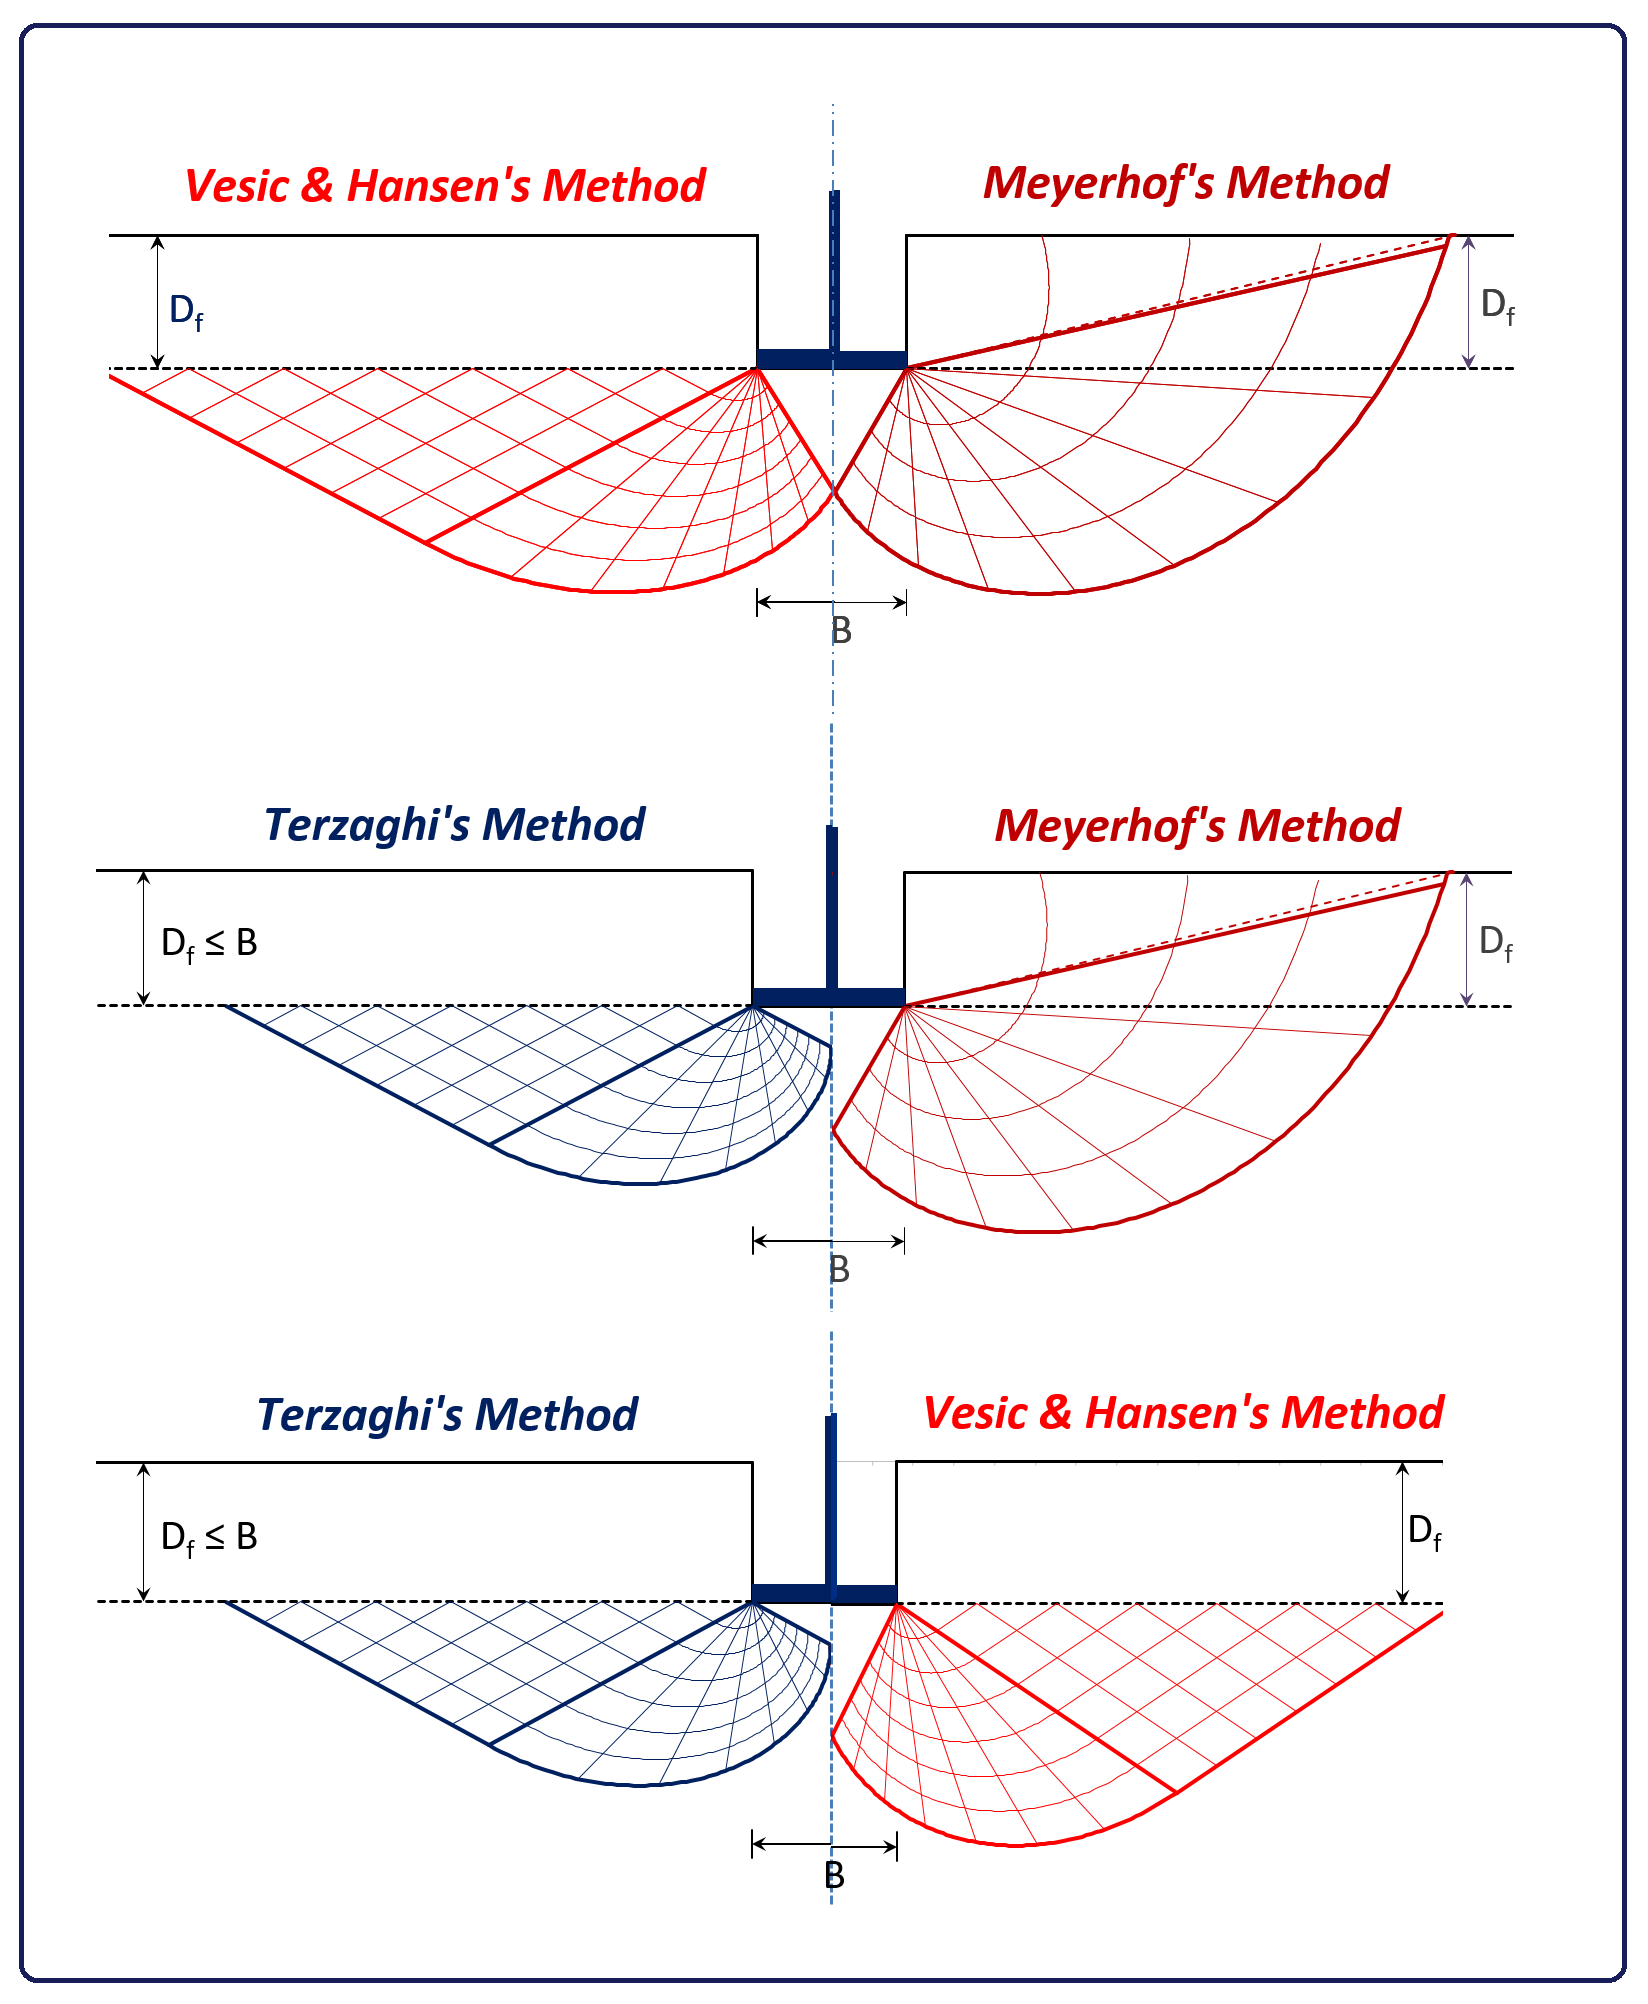
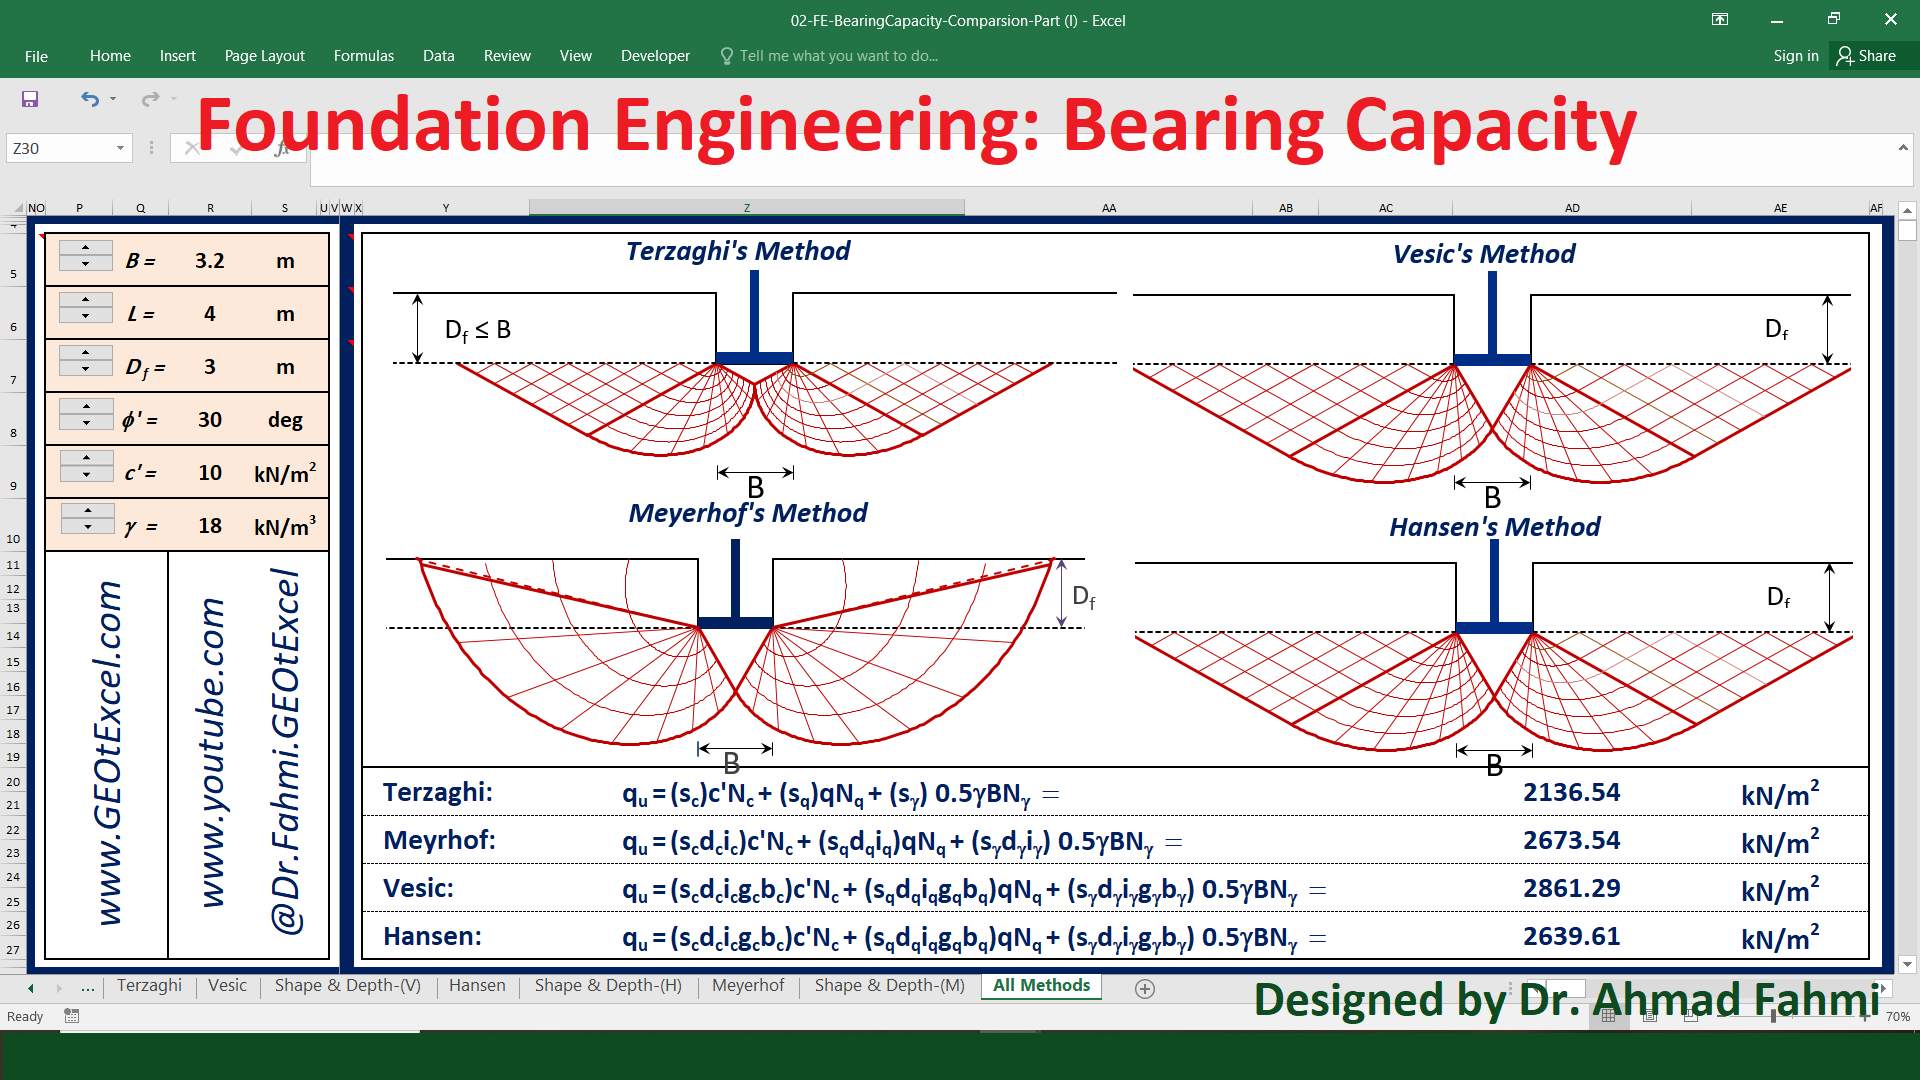
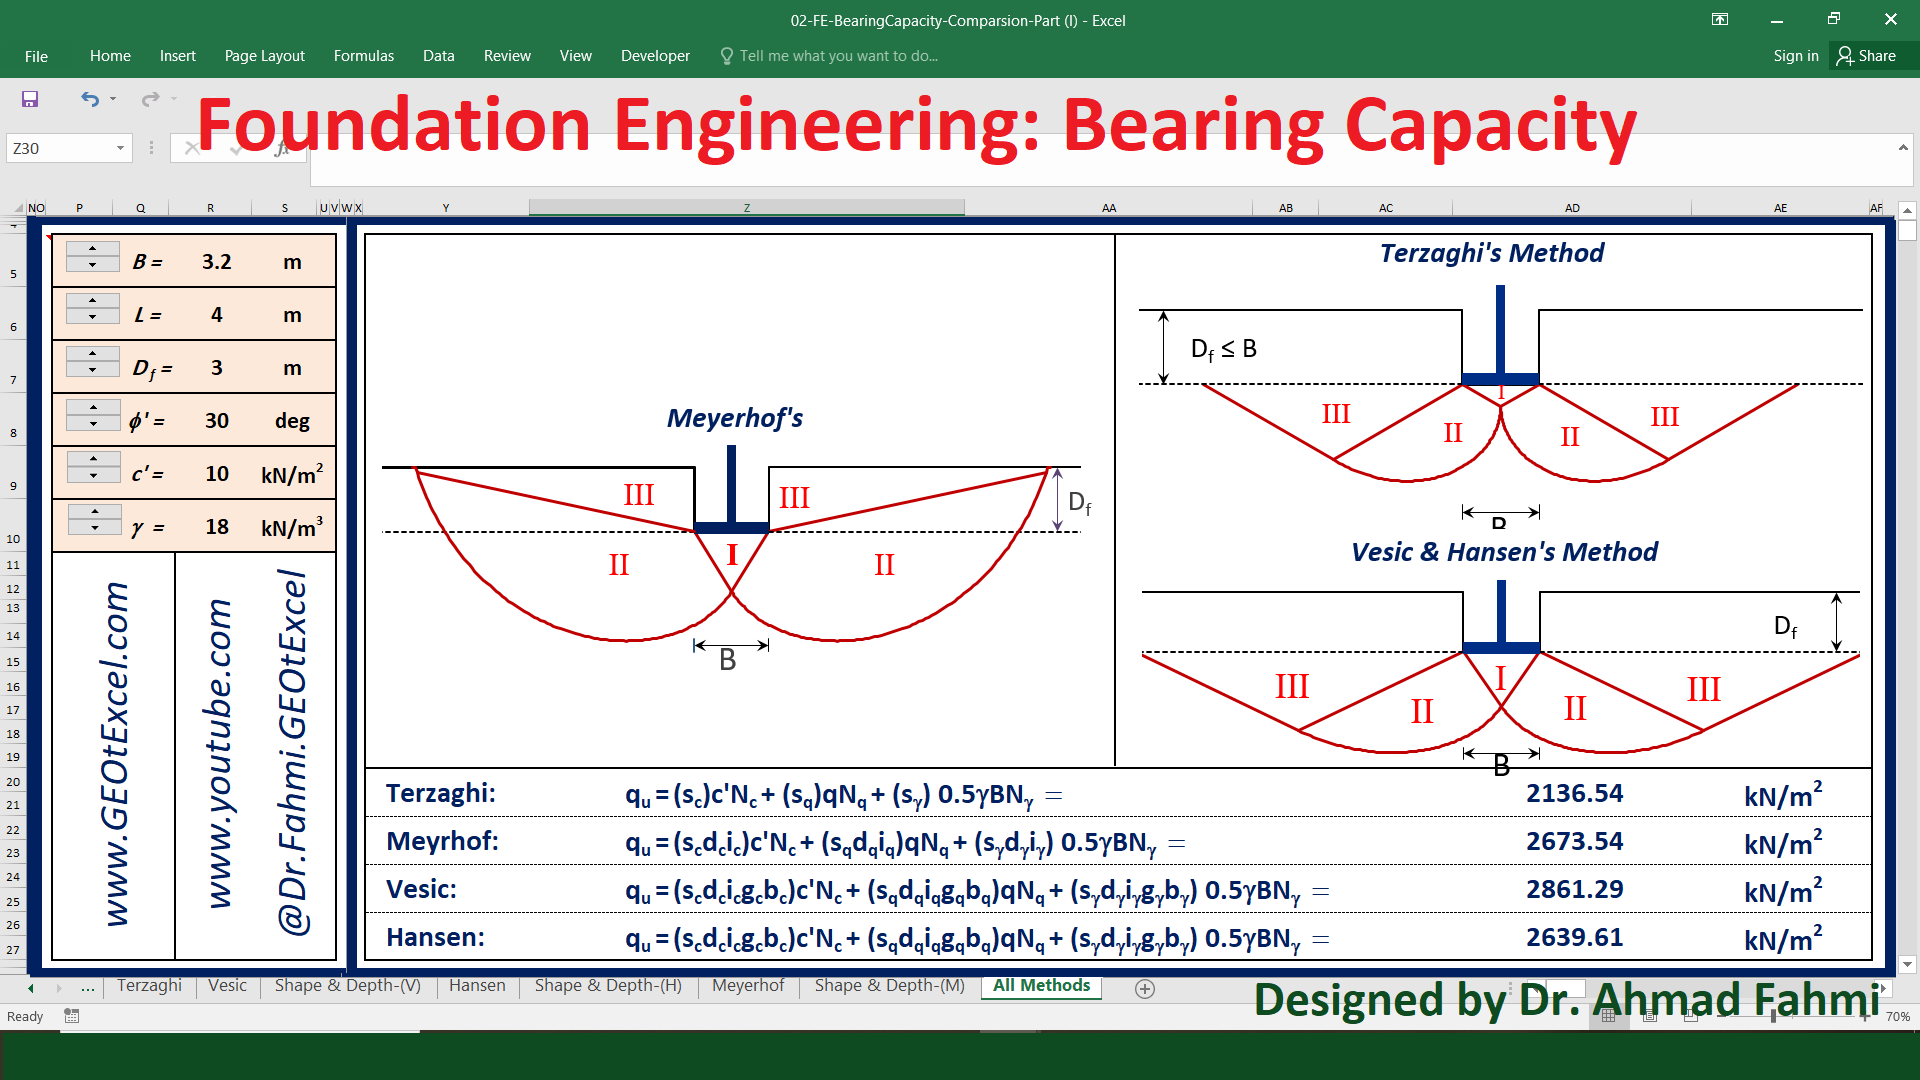
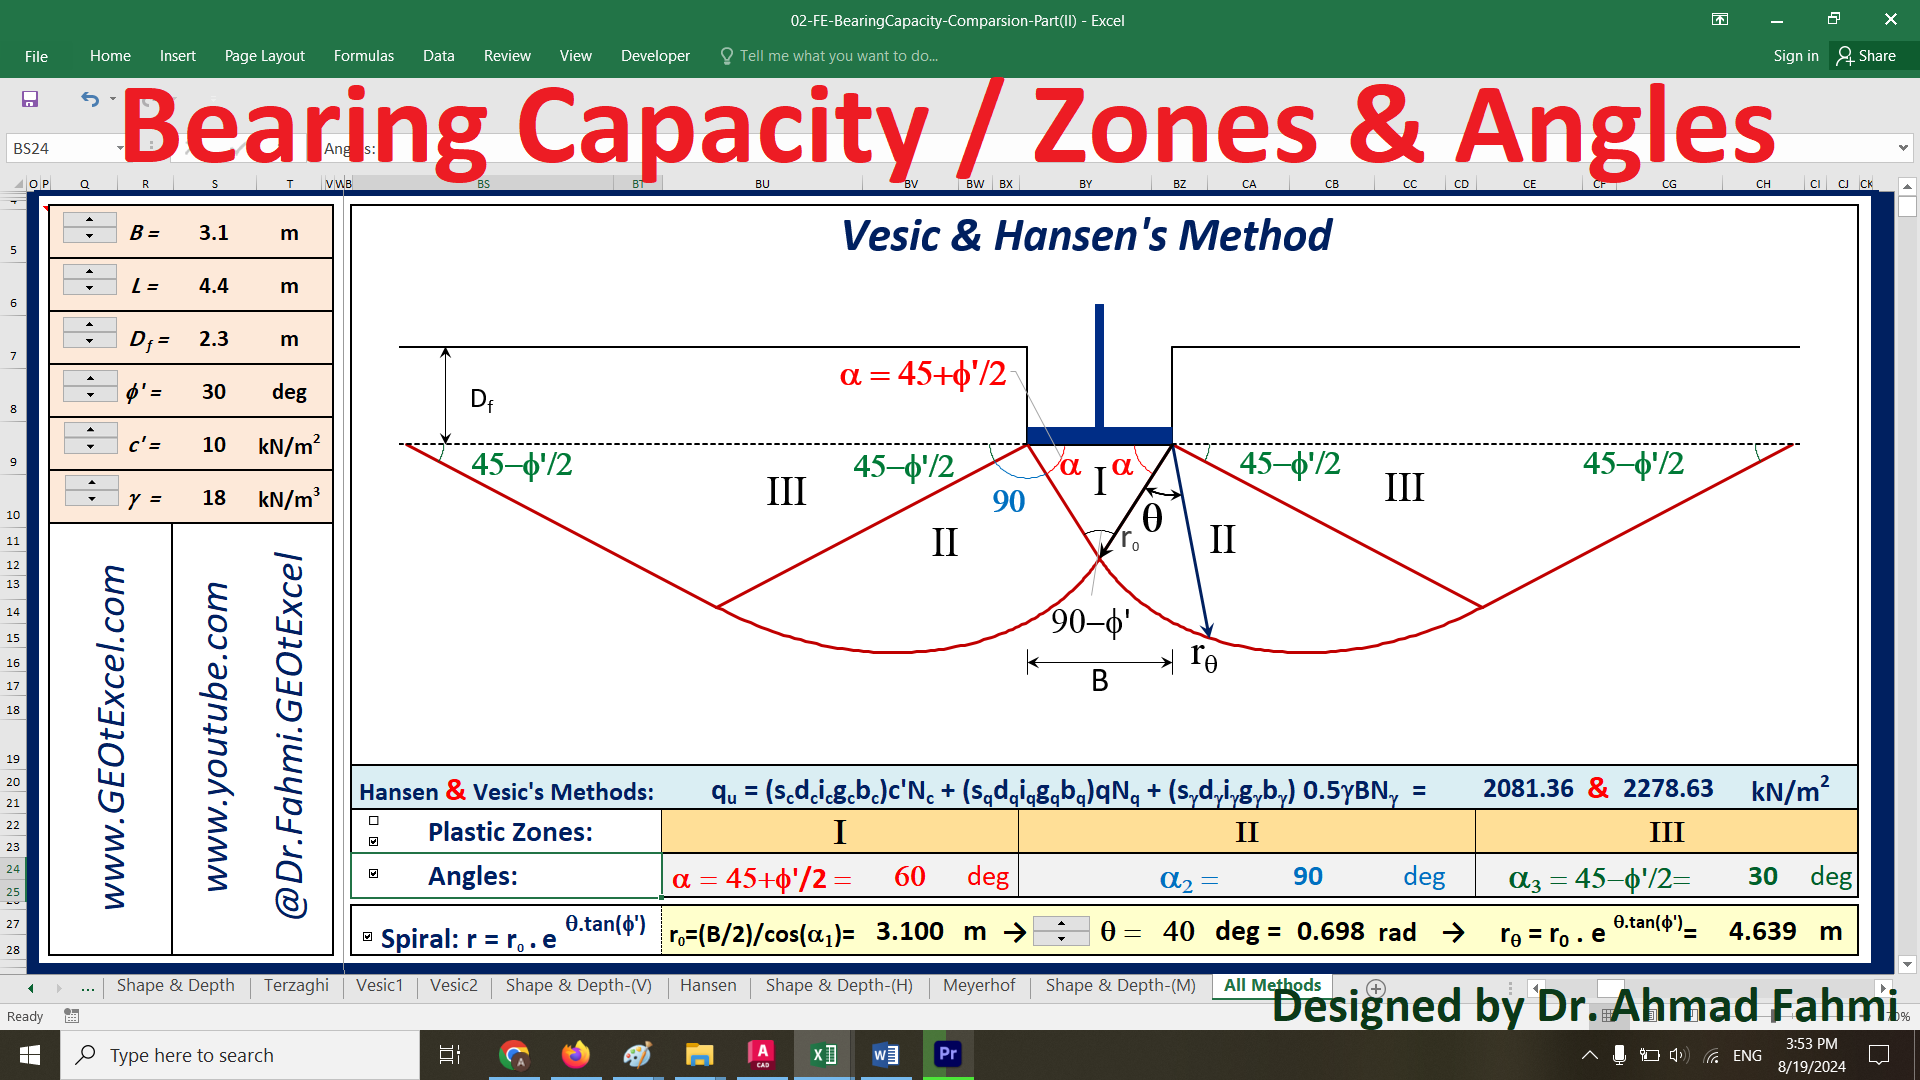
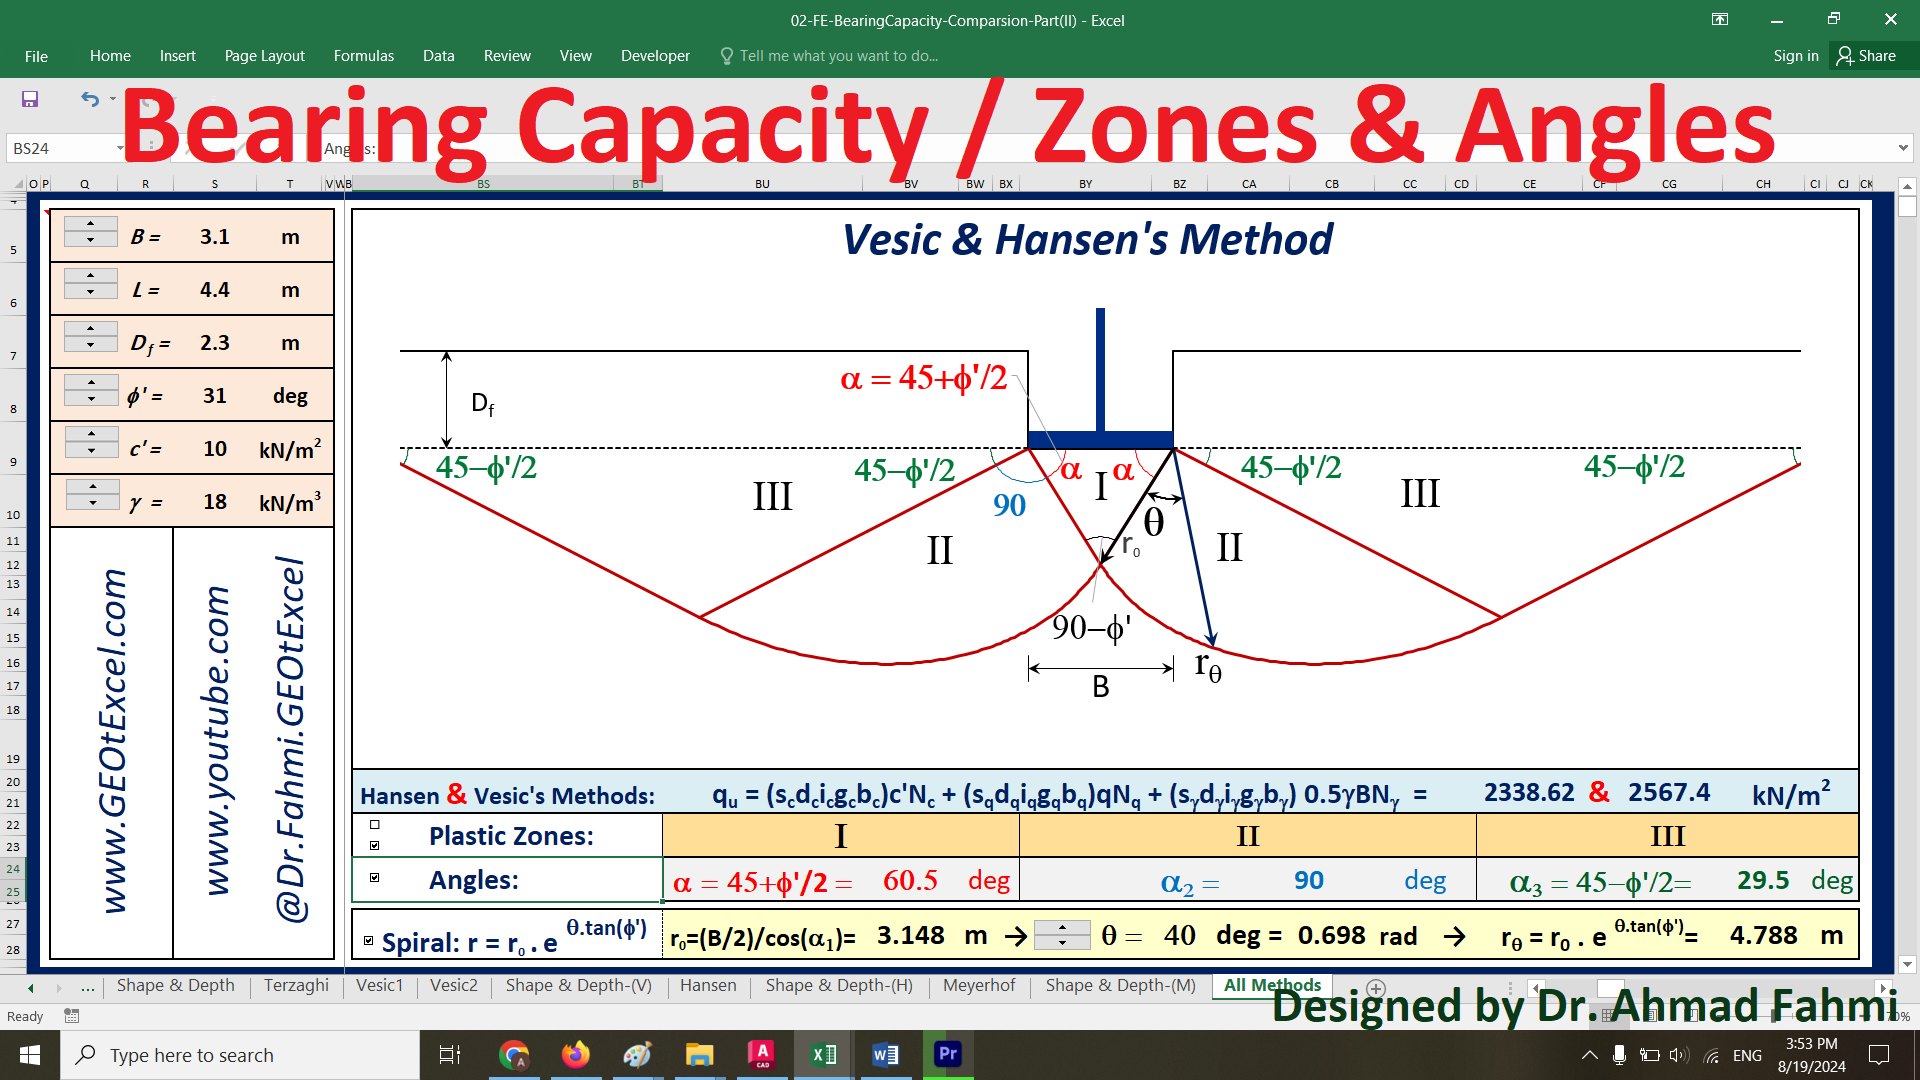
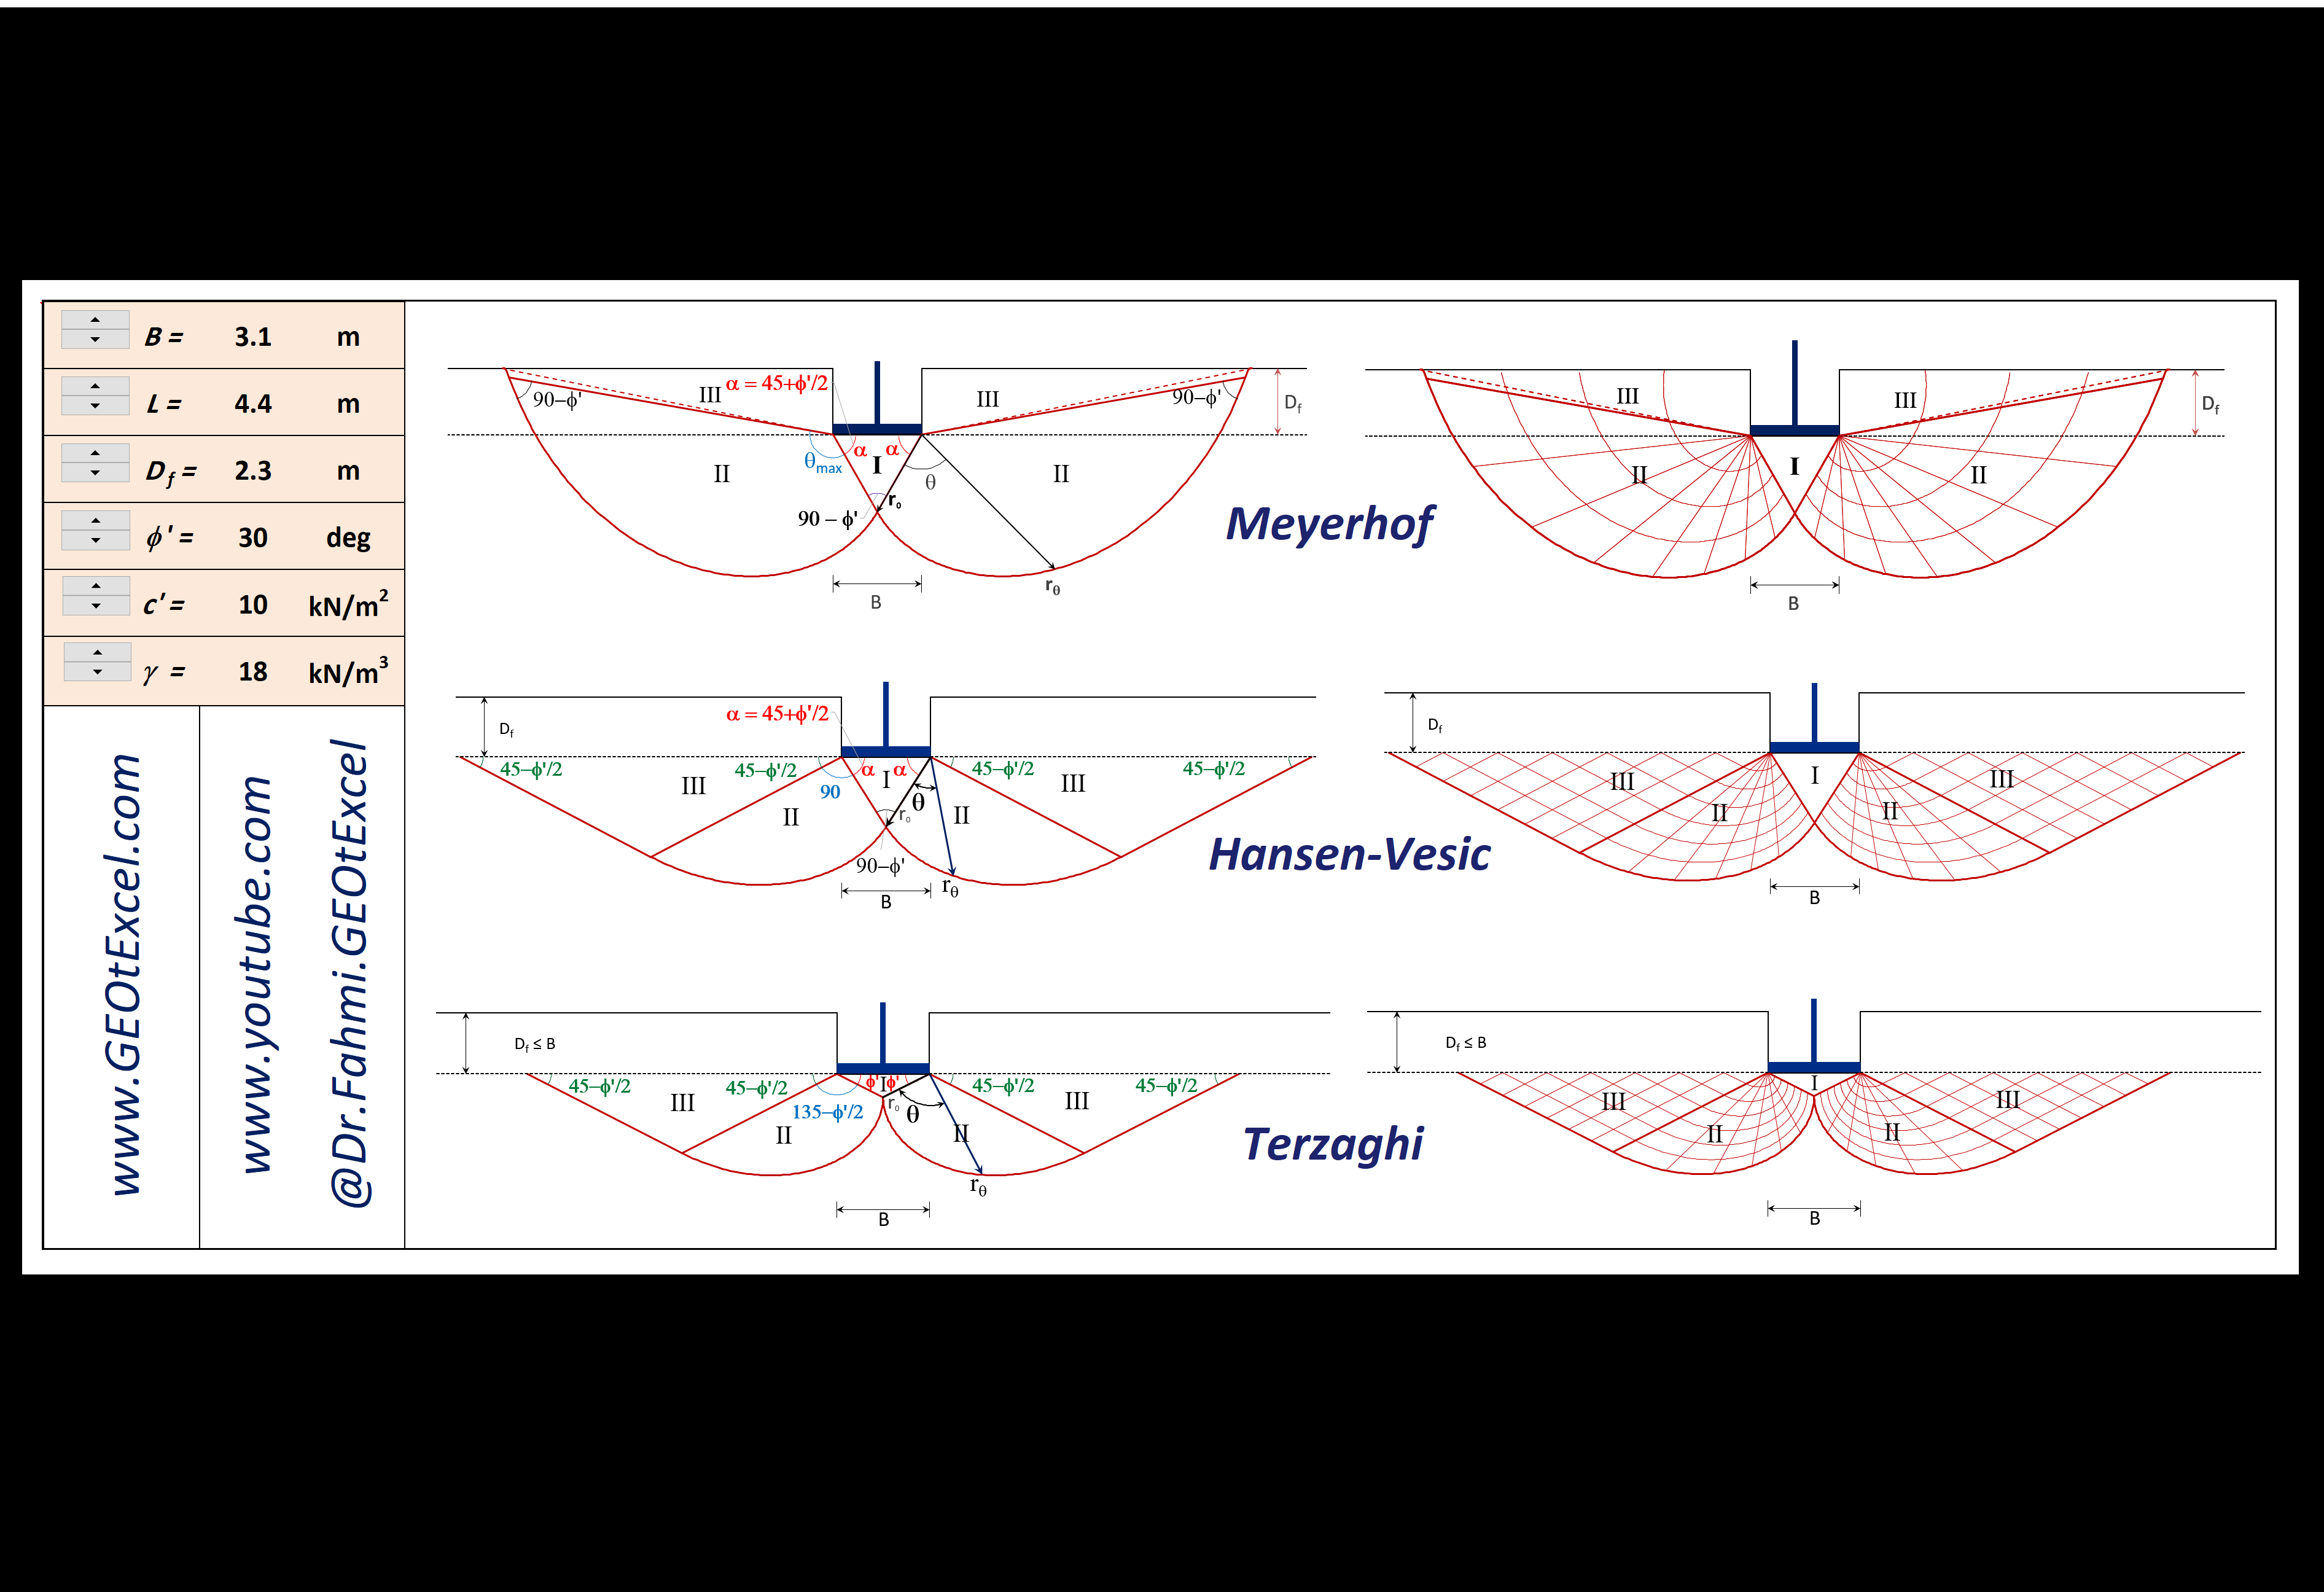
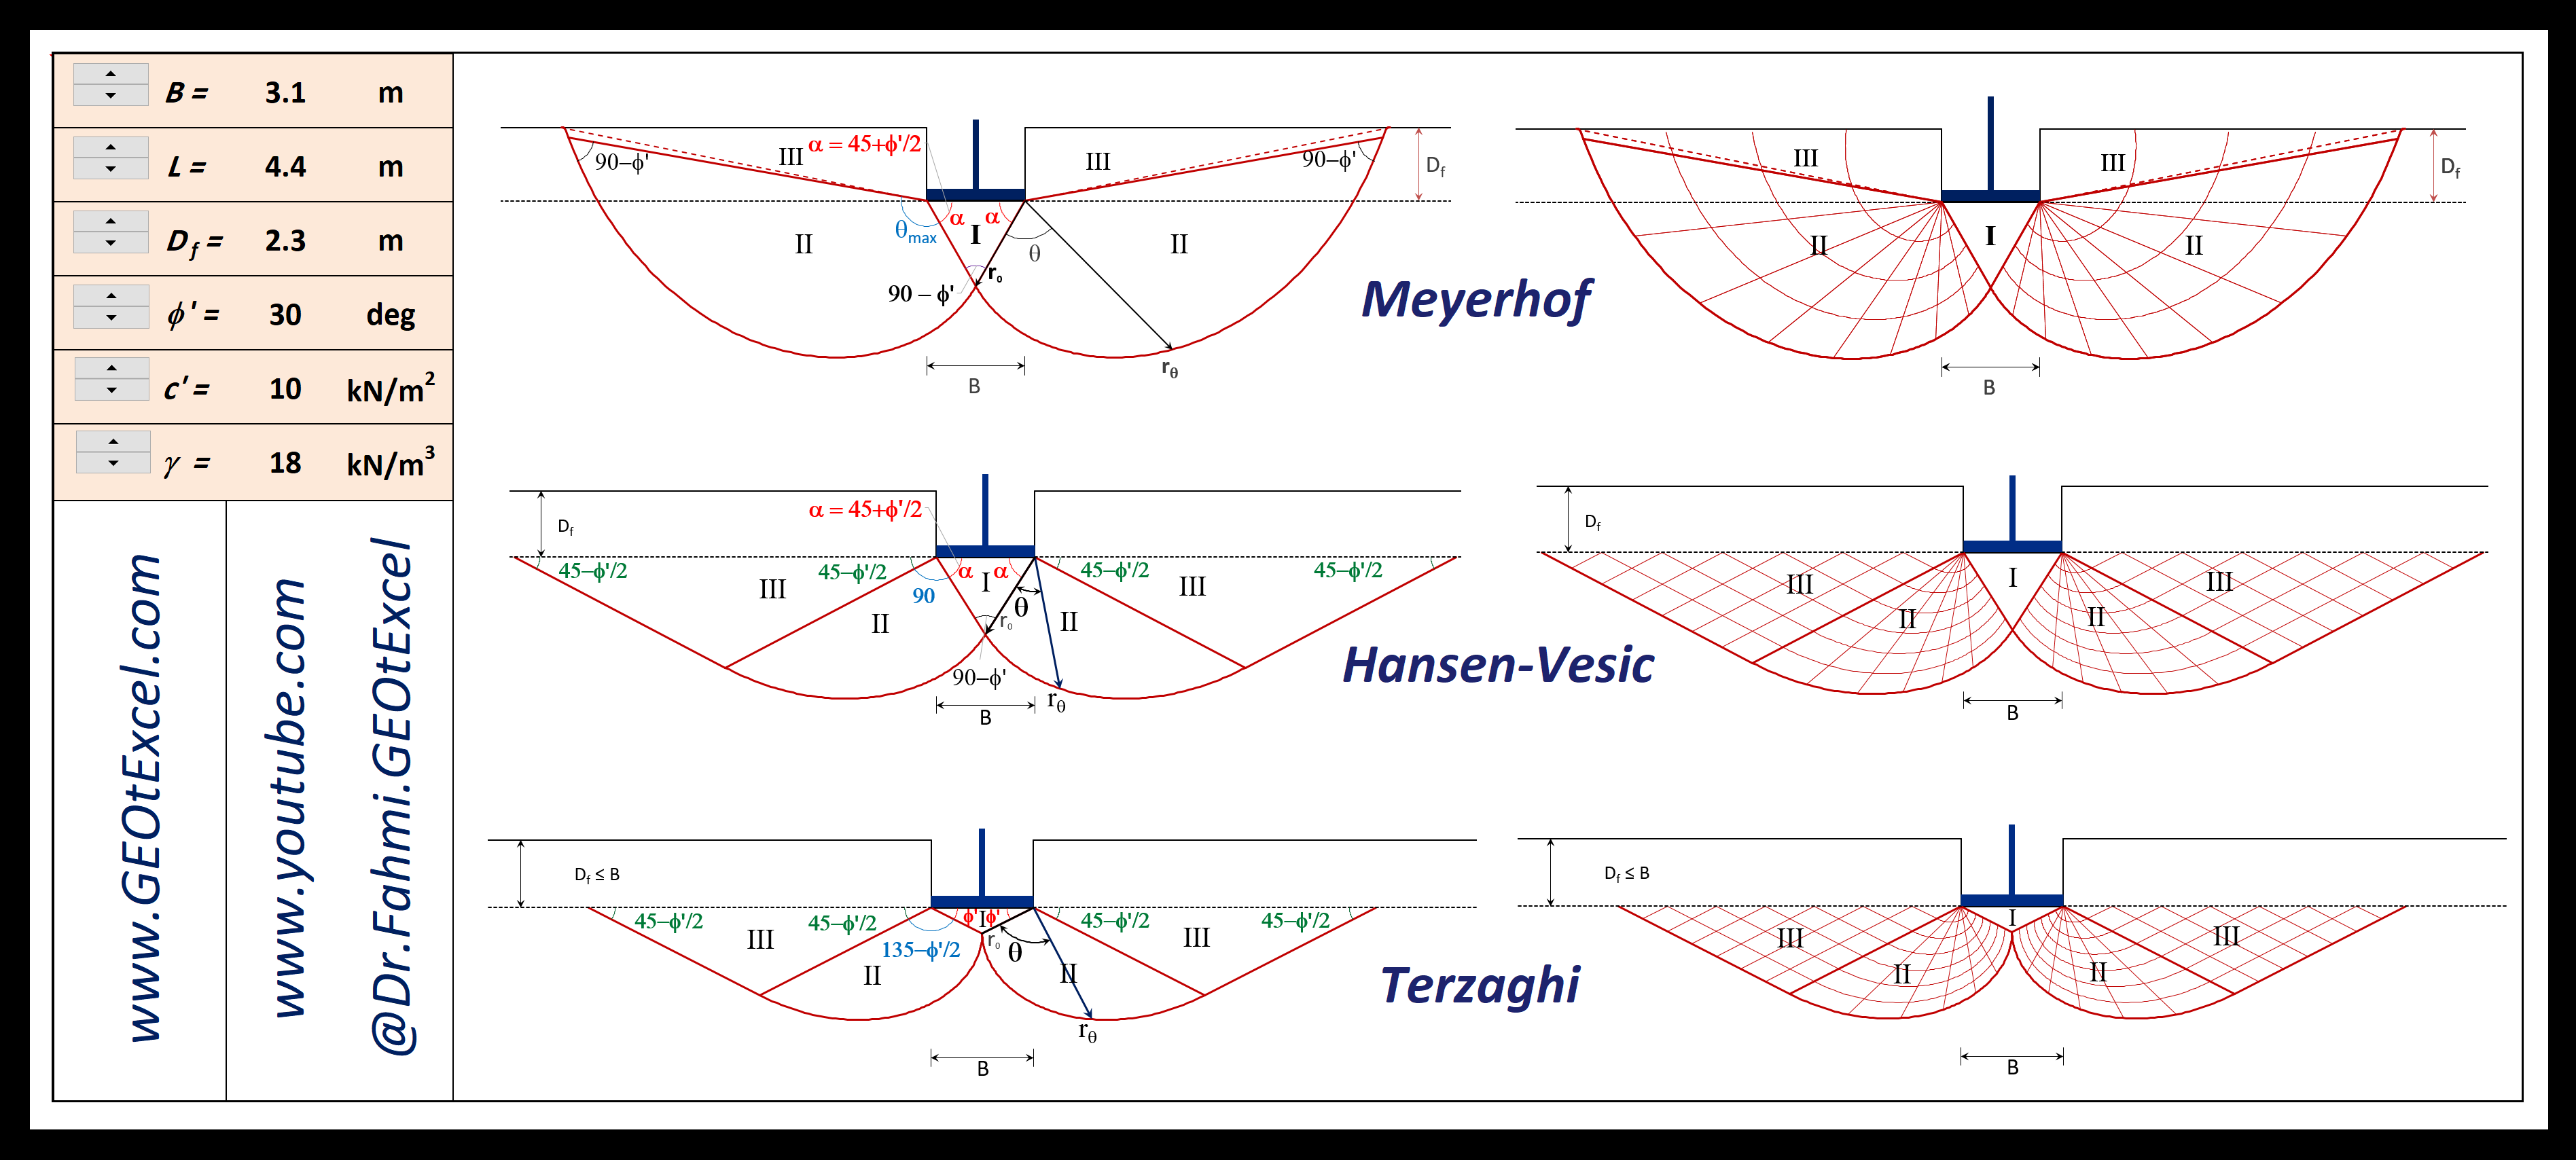
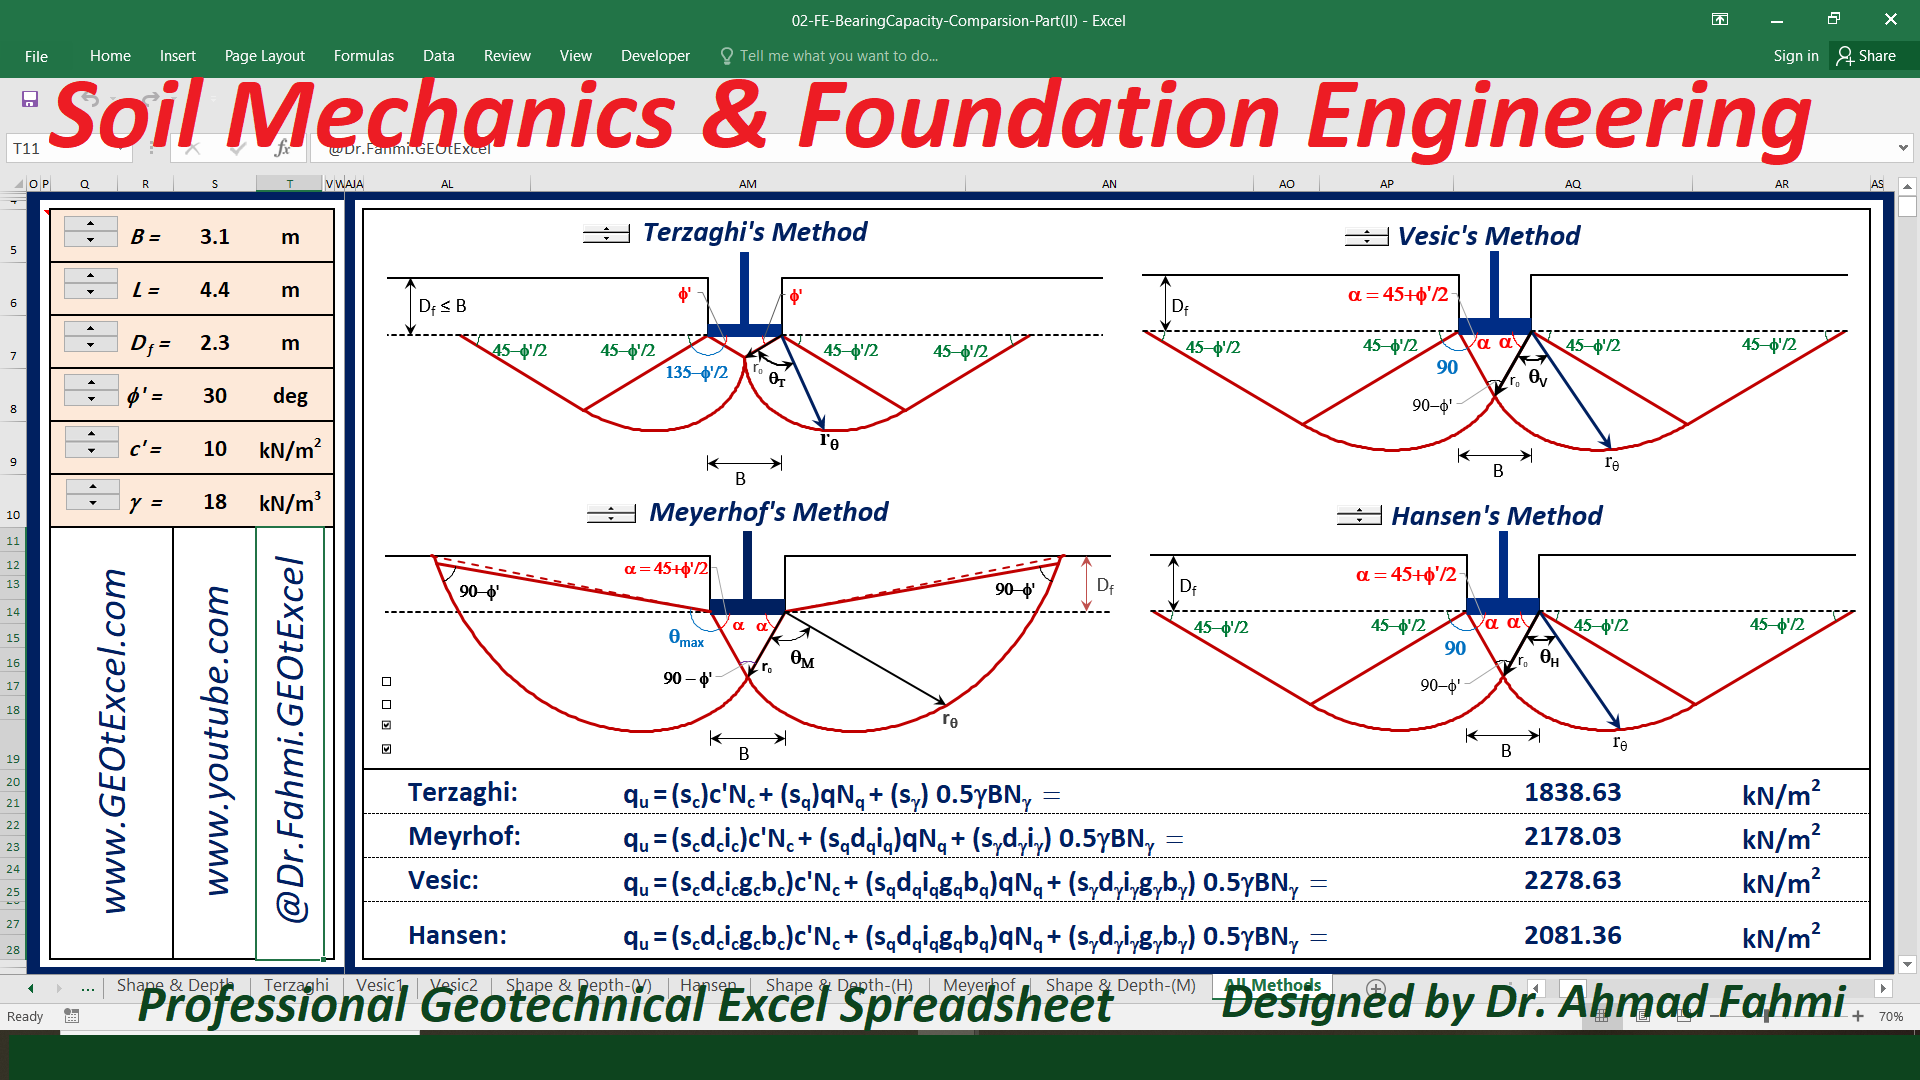
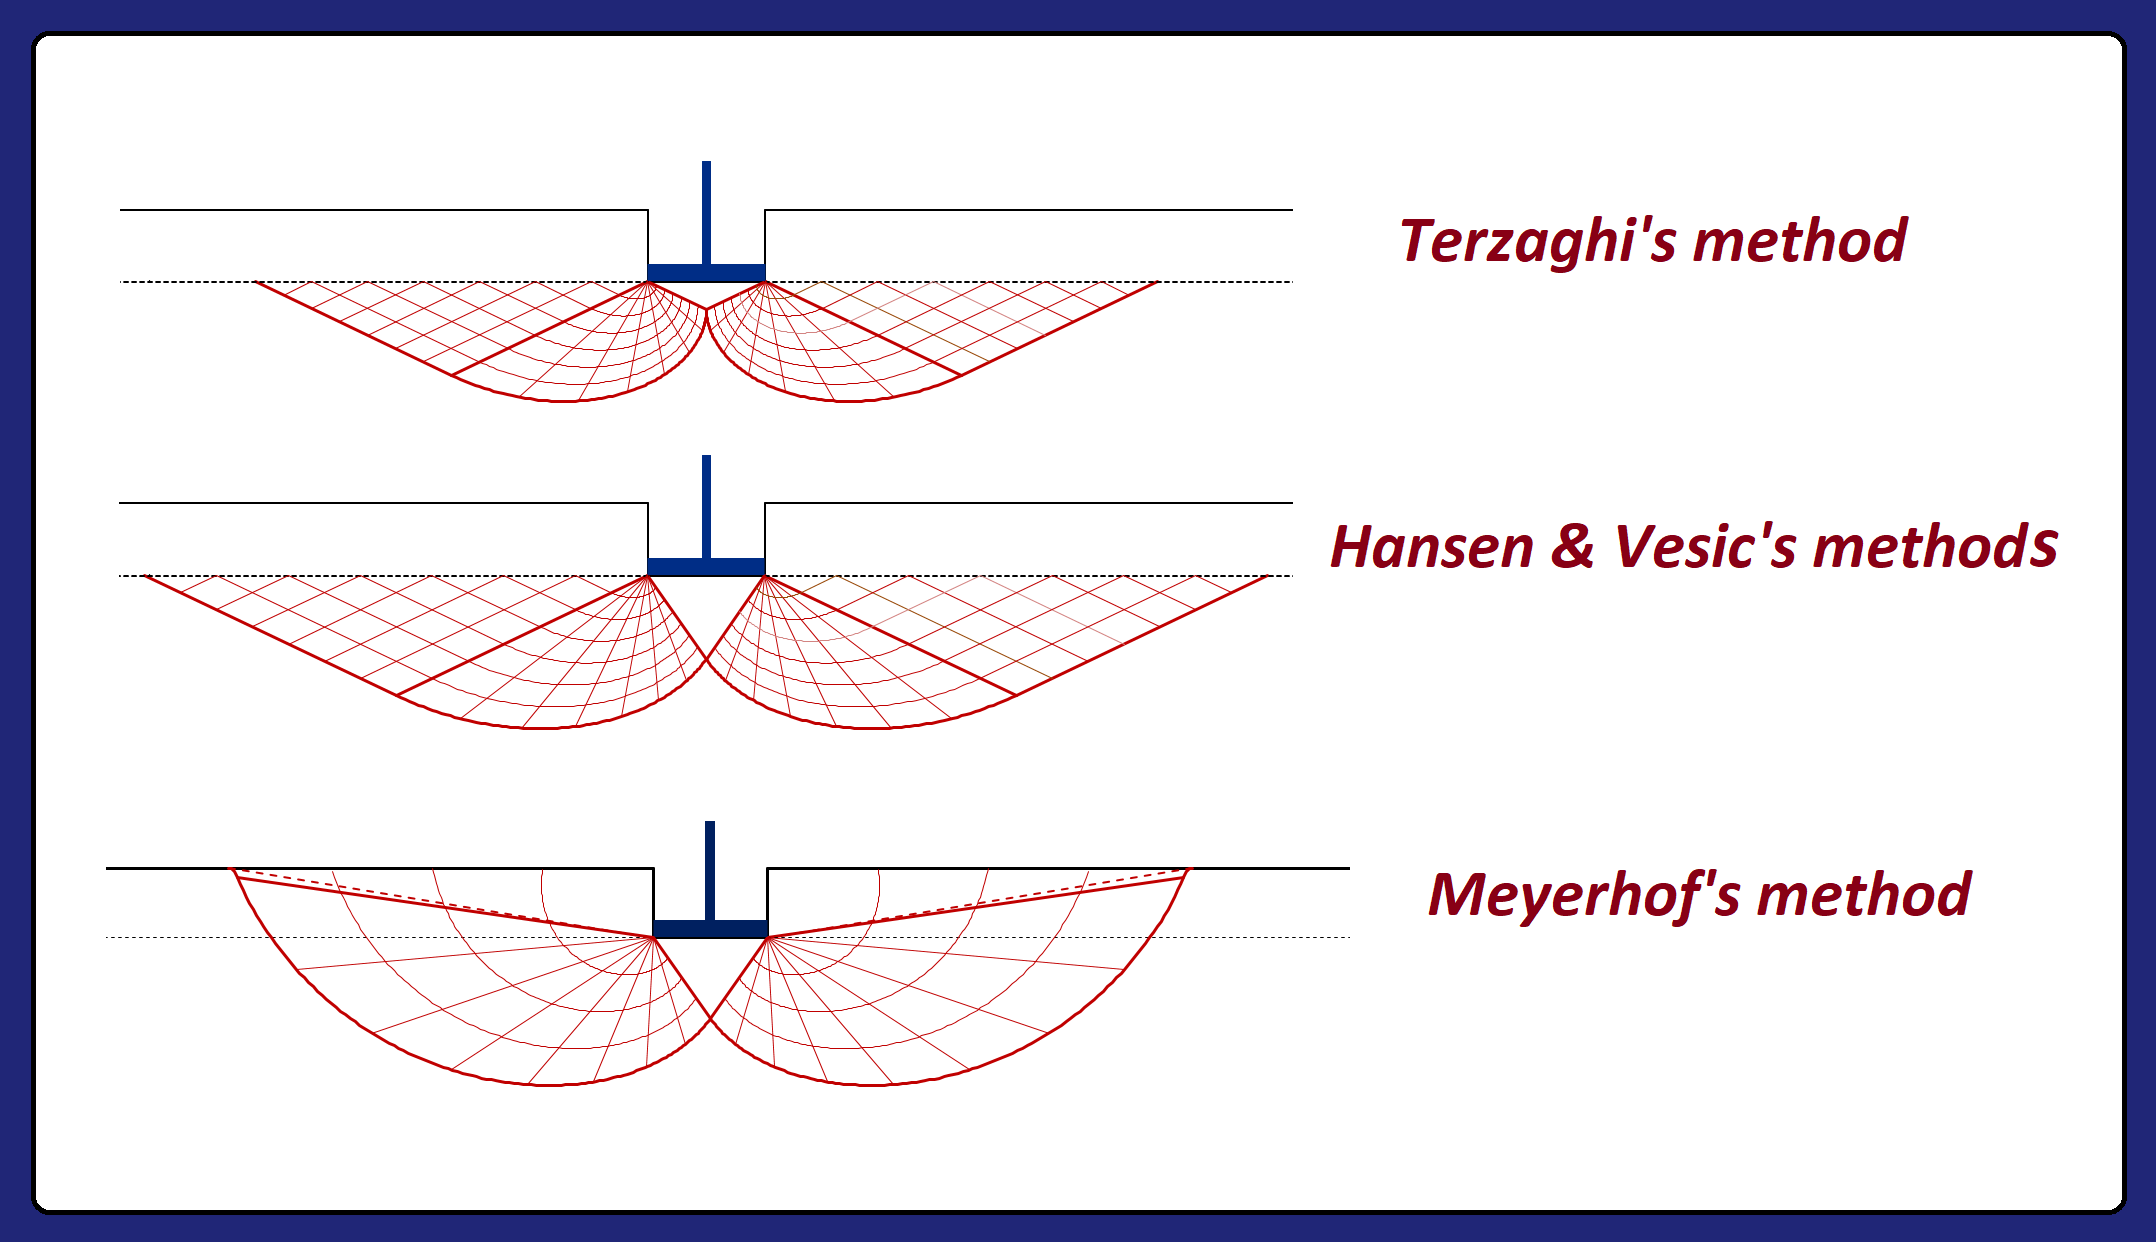
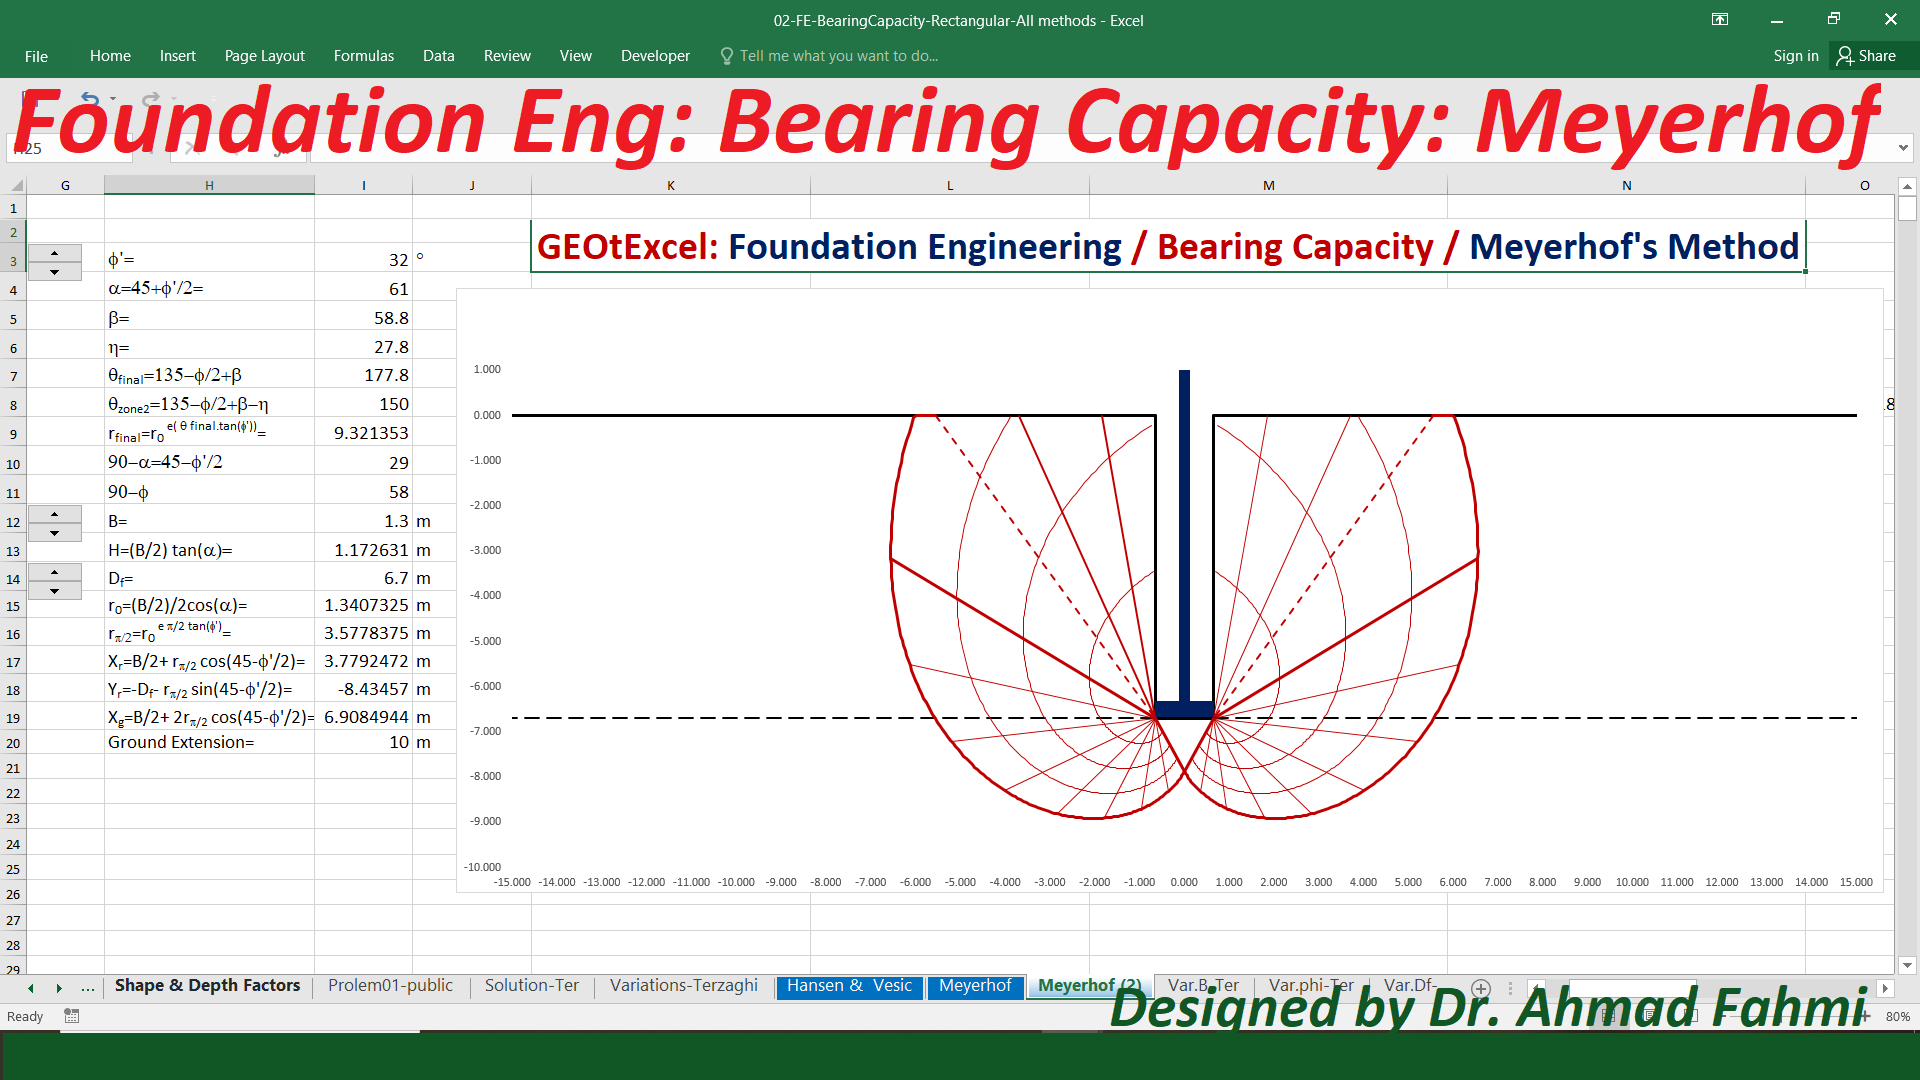
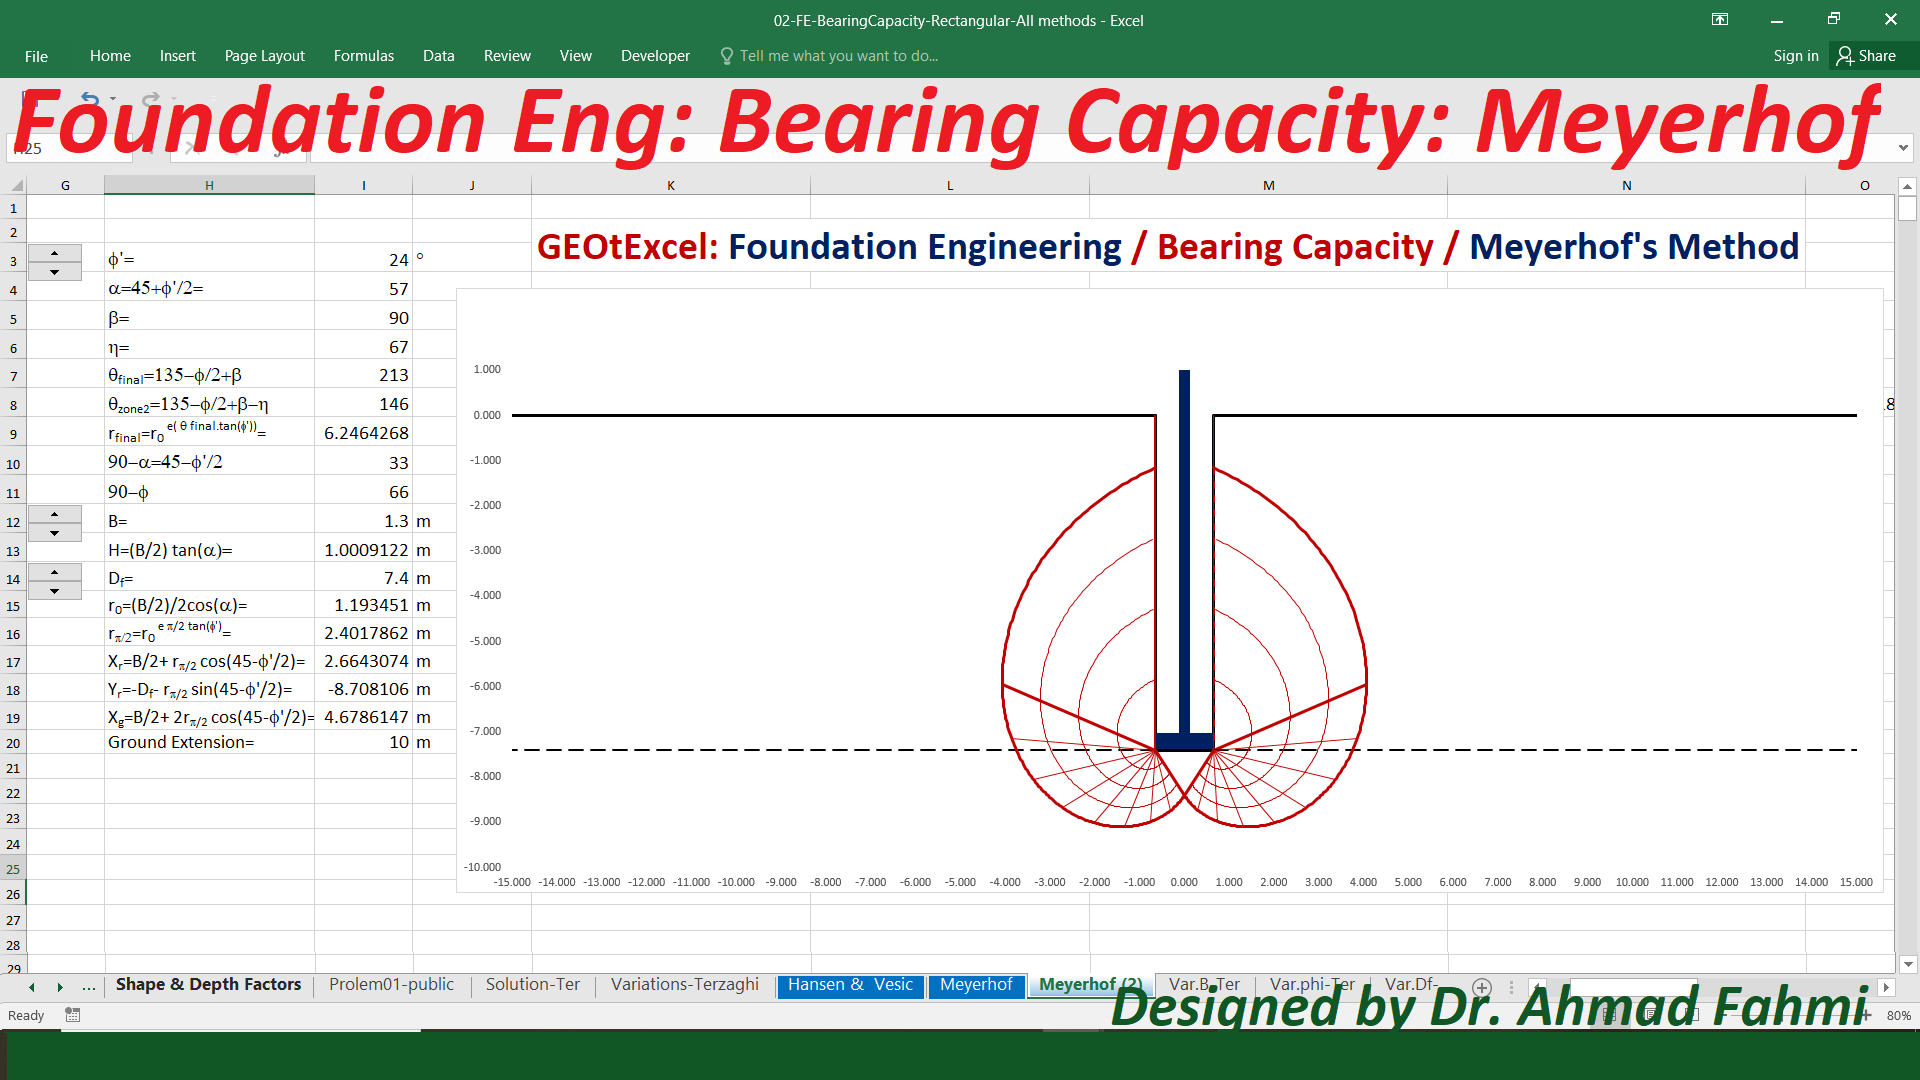
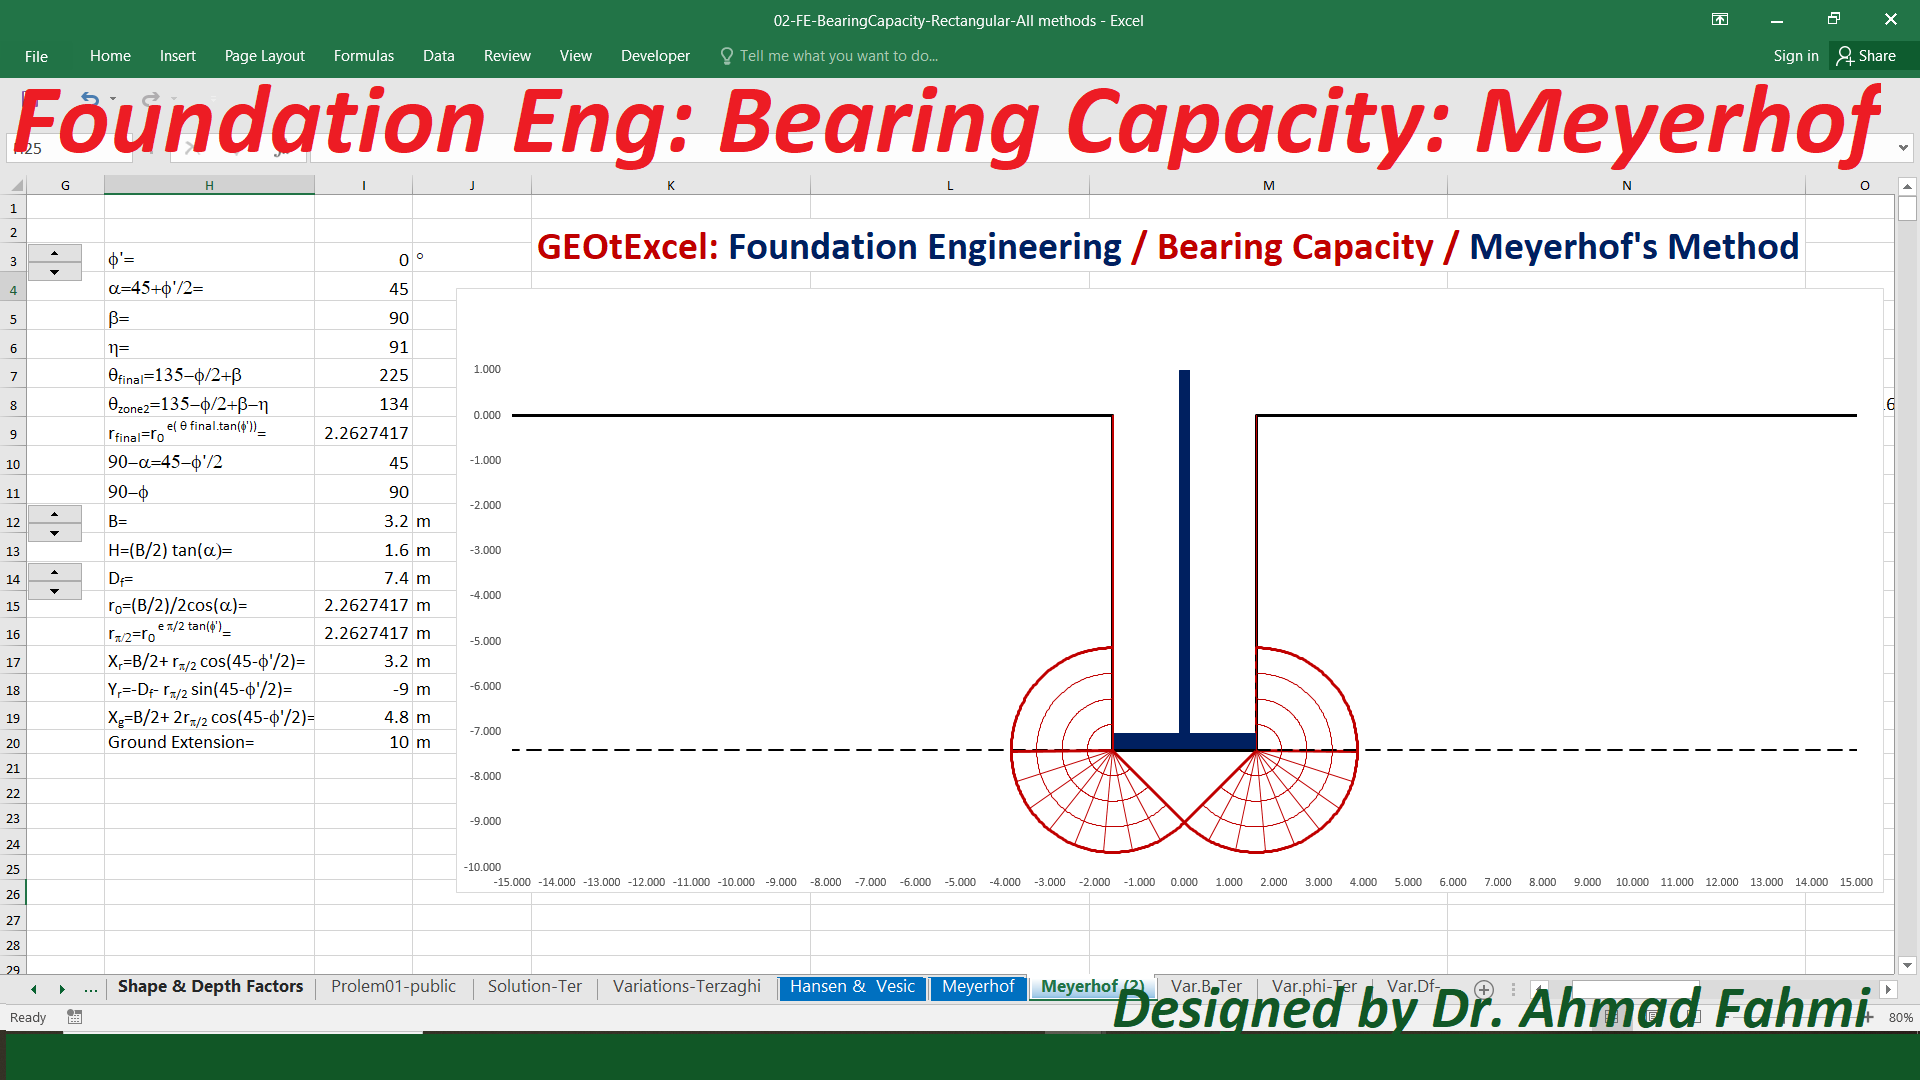
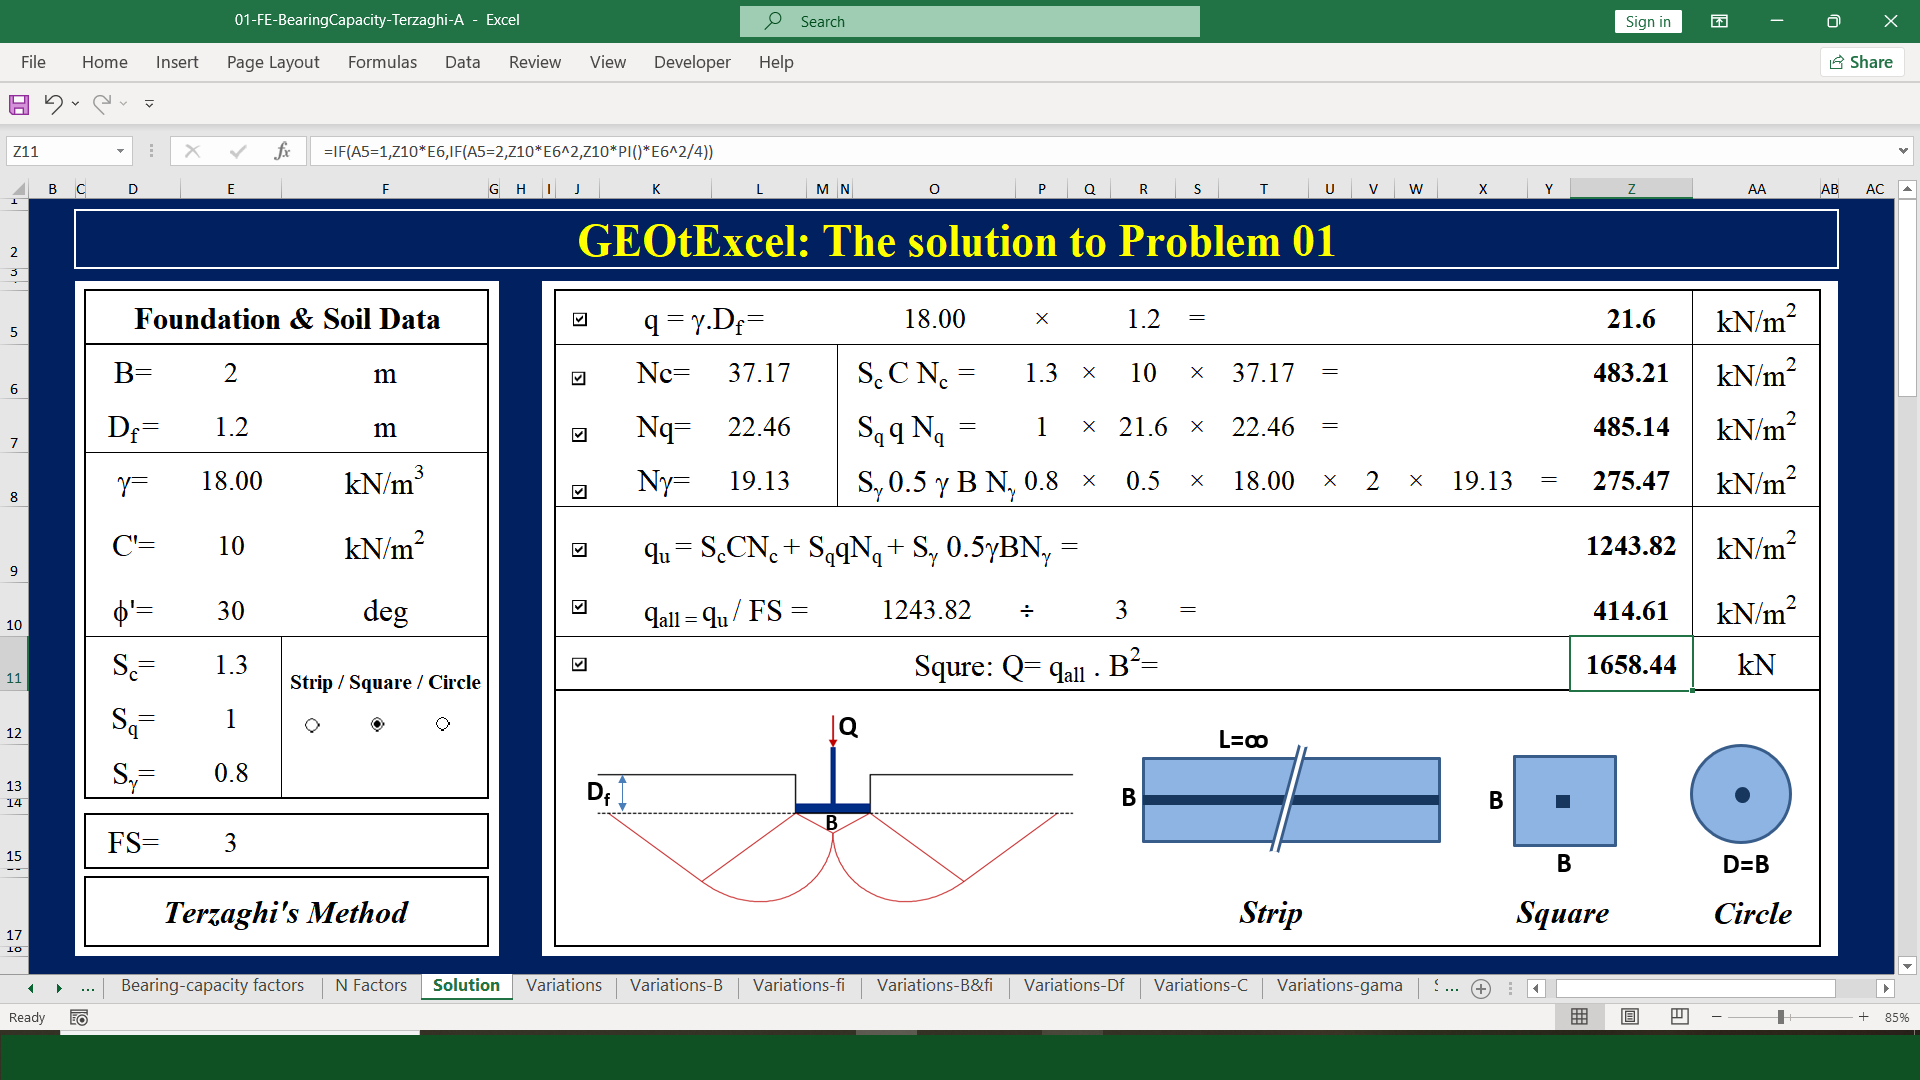
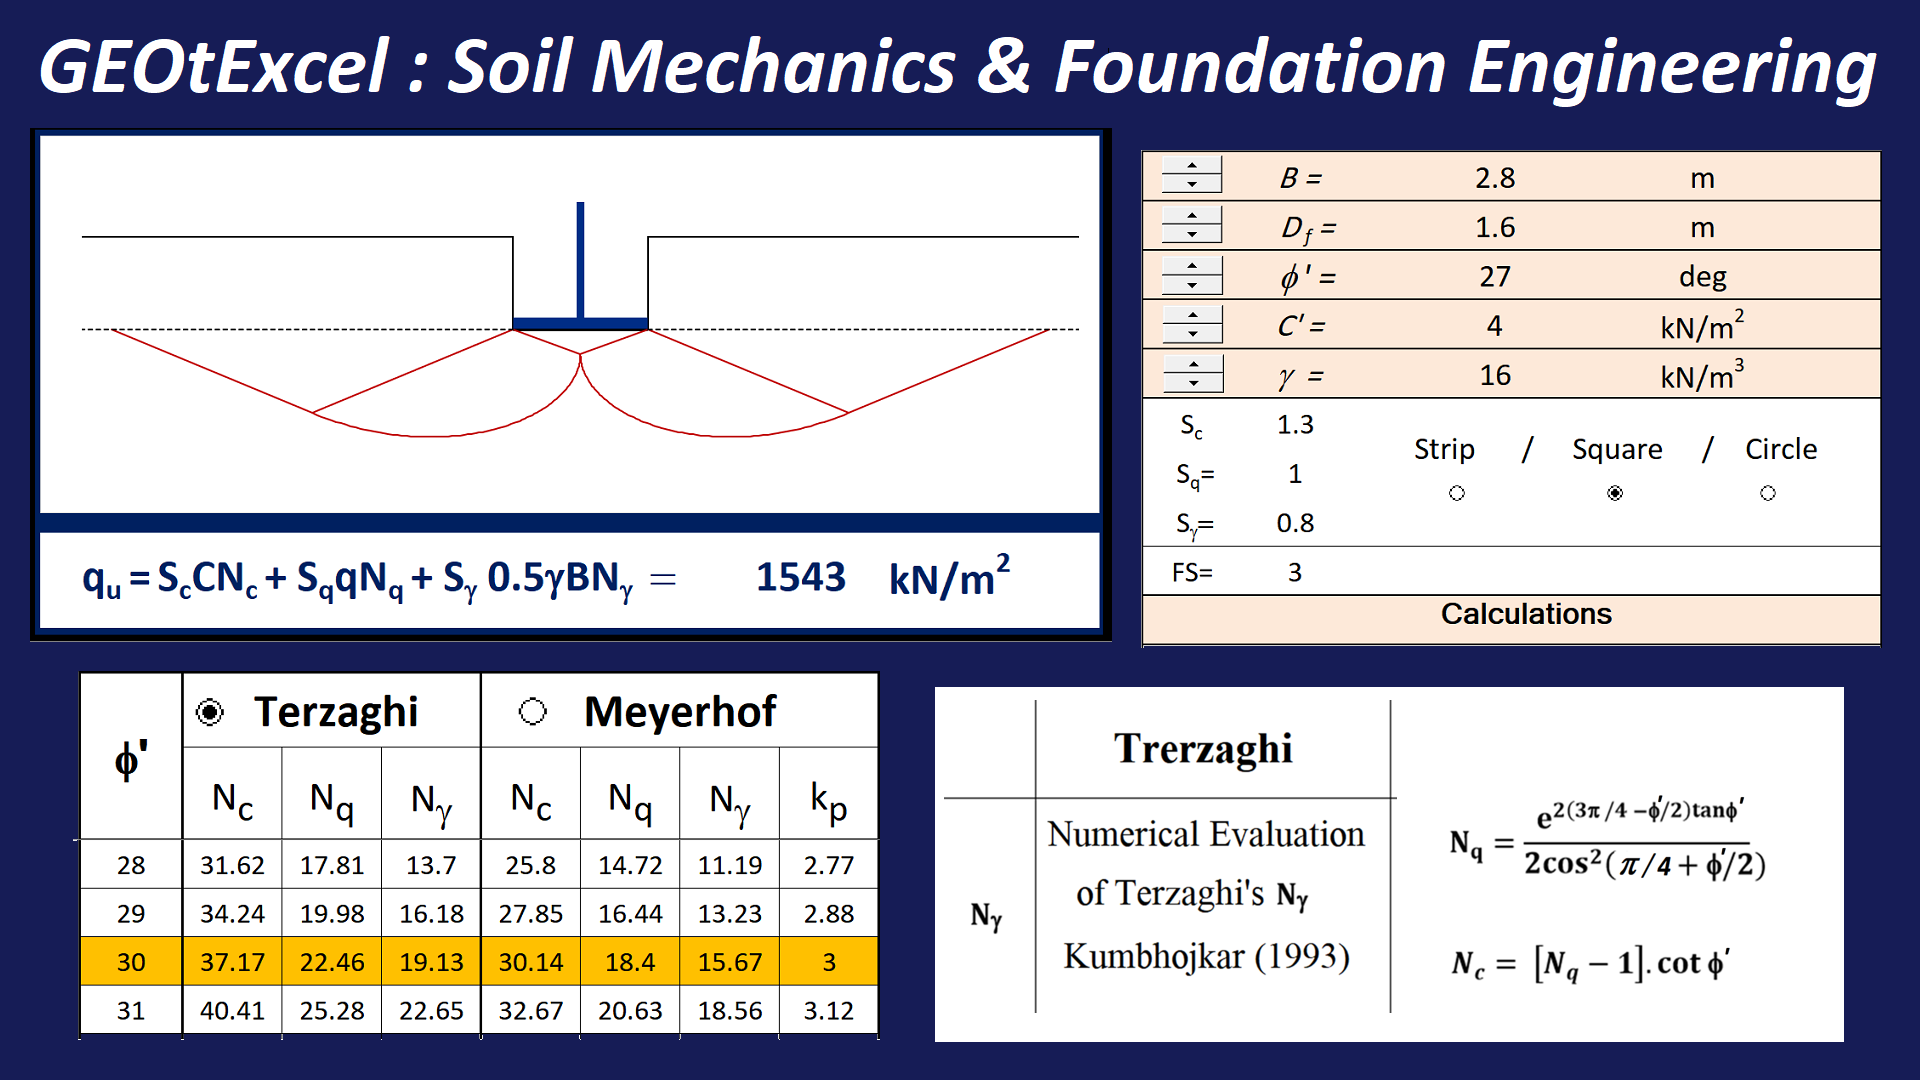
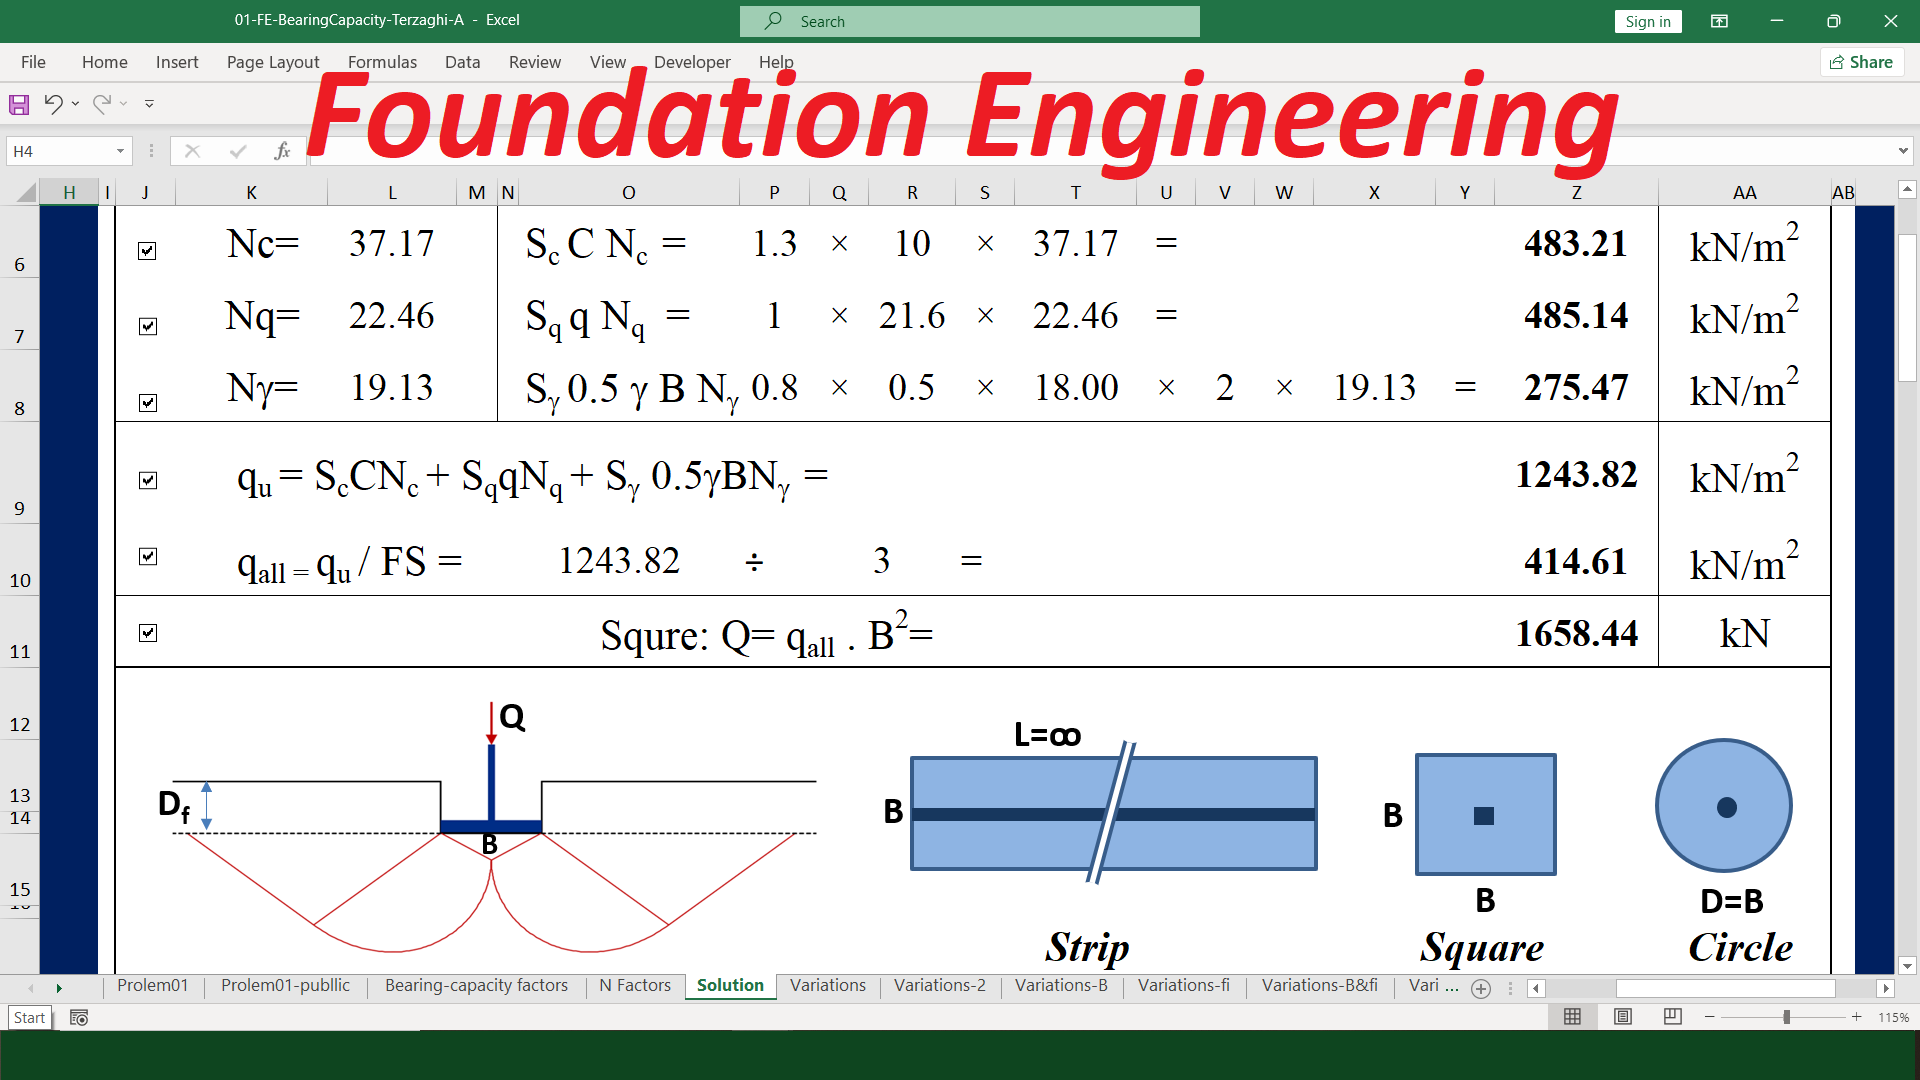
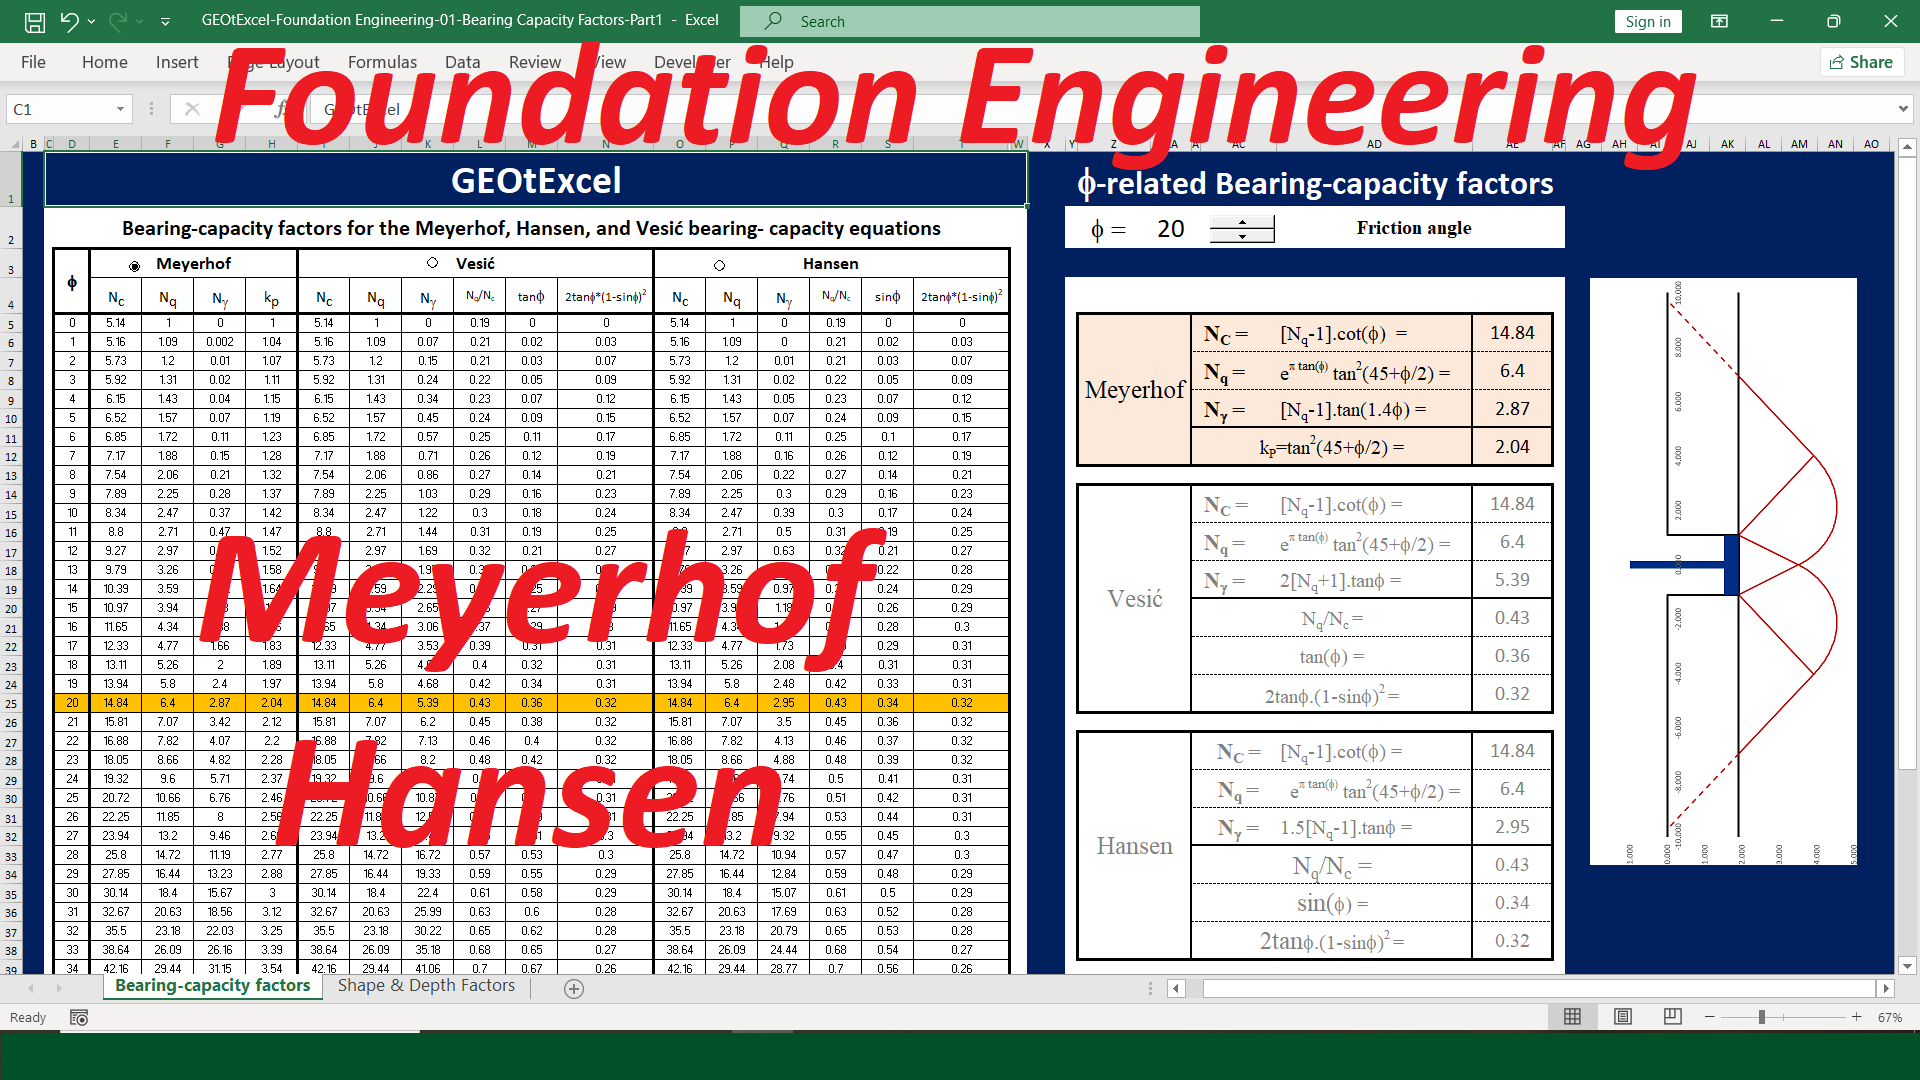
Calculating bearing capacity using Excel spreadsheets is a practical, concept-oriented approach for geotechnical engineers and designers. By organizing key soil parameters such as cohesion, internal friction angle, and unit weight into structured spreadsheets, engineers can streamline complex calculations into manageable, step-by-step processes. Excel allows for the efficient application of various bearing capacity methods, such as Terzaghi, Meyerhof, Hansen and Vesic’s equations, with built-in formulas that simplify the determination of foundation performance under different loading conditions. These methods take into account different factors such as soil type, depth, shape, and load conditions, ensuring comprehensive analysis. The concept-oriented design of the spreadsheet not only clarifies the relationships between variables but also enables easy adjustments to parameters, making it ideal for optimizing designs and testing multiple scenarios. This approach improves both the accuracy of calculations and the clarity of data presentation for project documentation and reporting, while allowing engineers to apply industry-standard methods seamlessly.
Watch the Related Videos on Our YouTube Channel (in English):
https://www.youtube.com/@Dr.Fahmi.GEOtExcel


https://www.youtube.com/watch?v=xafDNzuvdWM
https://www.youtube.com/watch?v=2A-nvMpLCTQ&t=32s
https://www.youtube.com/watch?v=CYsjxh9IuLk
https://www.linkedin.com/feed/update/urn:li:activity:7230479702426058752/
https://www.linkedin.com/feed/update/urn:li:activity:7229481766682558464/
https://www.linkedin.com/feed/update/urn:li:activity:7226966139539488768/
https://www.linkedin.com/feed/update/urn:li:activity:7230130595618582529/
https://www.youtube.com/@Dr.Fahmi.GEOtExcel
https://www.youtube.com/watch?v=eoQZksrBvrI&t=61s
https://www.youtube.com/watch?v=eoQZksrBvrI&t=61s
https://www.youtube.com/watch?v=cIzYpDOUlVo
GEOtExcel YouTube Channel
https://www.youtube.com/@Dr.Fahmi.GEOtExcel
Designed by Dr. Ahmad Fahmi

https://www.youtube.com/@Dr.Fahmi.GEOtExcel
https://www.youtube.com/@Dr.Fahmi.GEOtExcel
https://www.youtube.com/@Dr.Fahmi.GEOtExcel
https://www.youtube.com/@Dr.Fahmi.GEOtExcel
https://www.youtube.com/@Dr.Fahmi.GEOtExcel
https://www.youtube.com/@Dr.Fahmi.GEOtExcel
https://www.youtube.com/@Dr.Fahmi.GEOtExcel
https://www.youtube.com/@Dr.Fahmi.GEOtExcel
https://www.youtube.com/@Dr.Fahmi.GEOtExcel
https://www.youtube.com/@Dr.Fahmi.GEOtExcel
https://www.youtube.com/@Dr.Fahmi.GEOtExcel
https://www.youtube.com/@Dr.Fahmi.GEOtExcel
https://www.youtube.com/@Dr.Fahmi.GEOtExcel
https://www.youtube.com/@Dr.Fahmi.GEOtExcel
https://www.youtube.com/@Dr.Fahmi.GEOtExcel
https://www.youtube.com/@Dr.Fahmi.GEOtExcel
https://www.youtube.com/@Dr.Fahmi.GEOtExcel
https://www.youtube.com/@Dr.Fahmi.GEOtExcel
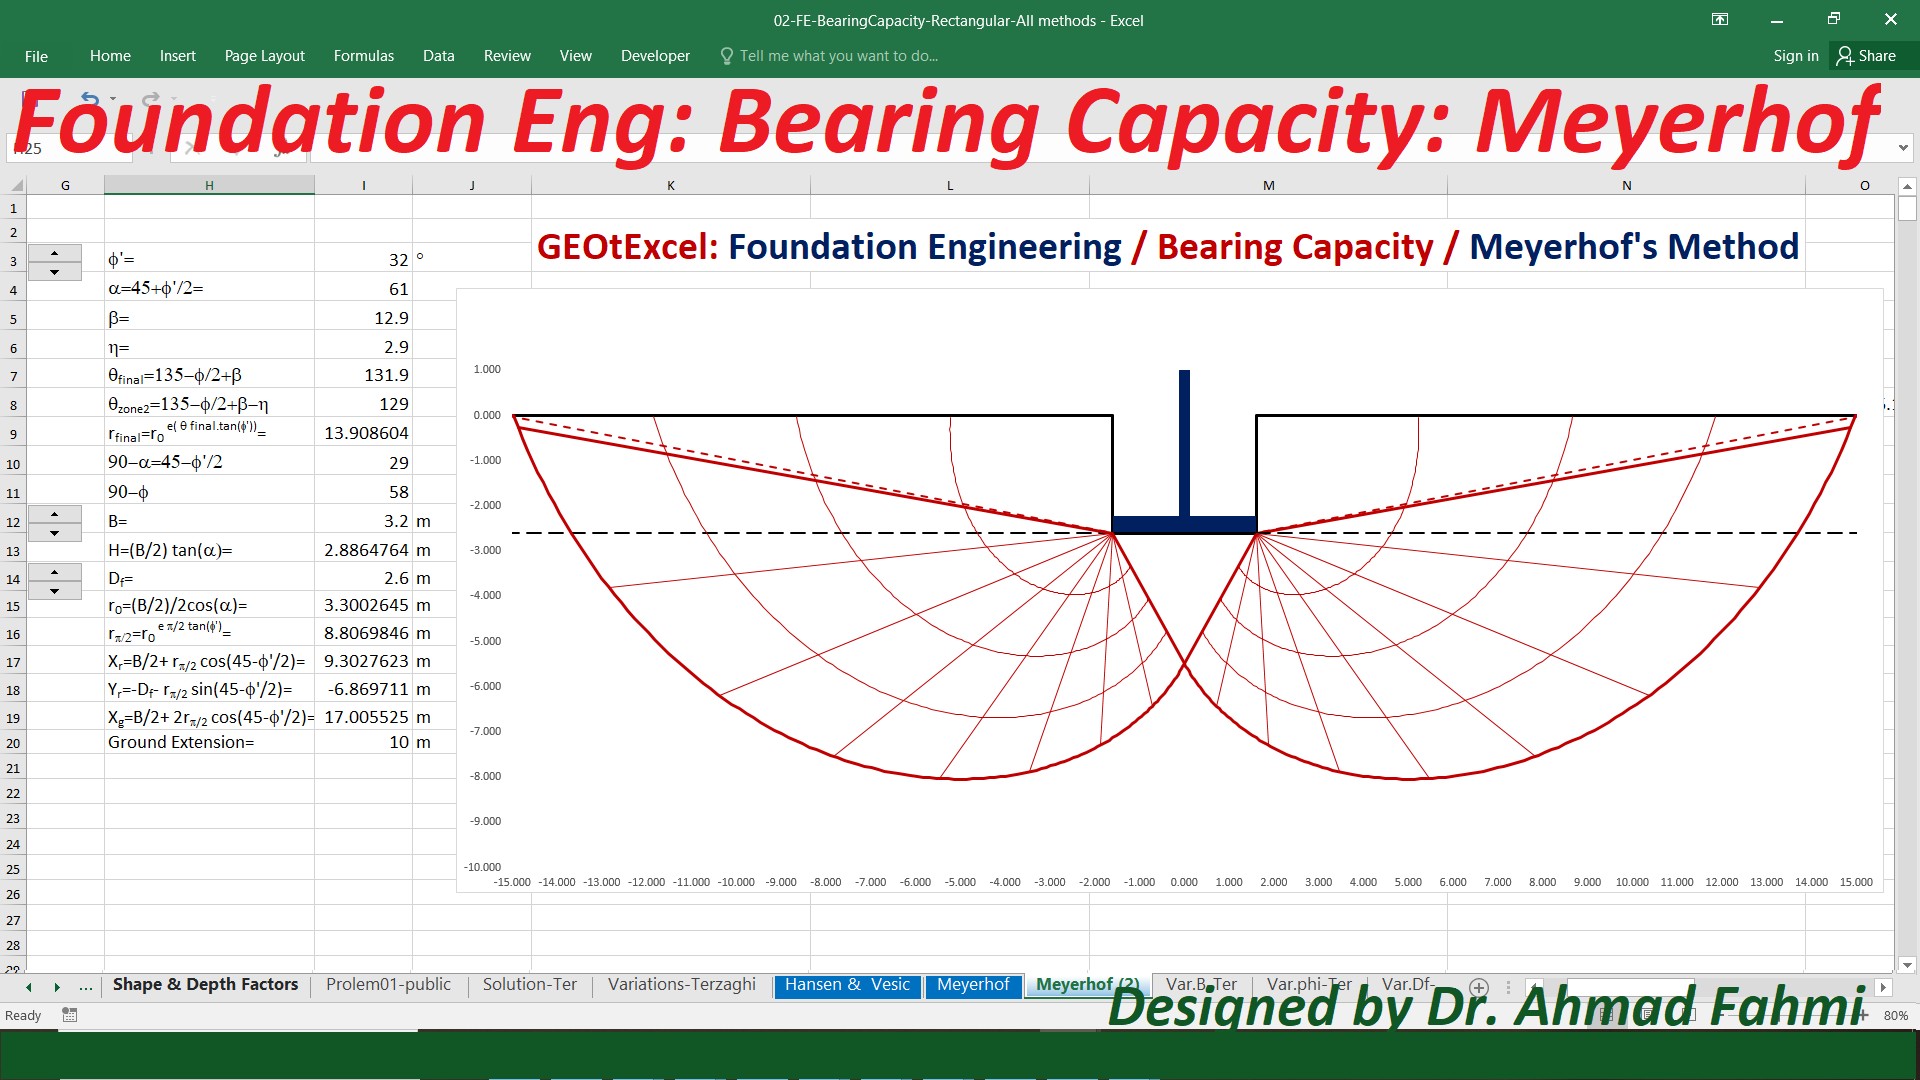
https://www.youtube.com/@Dr.Fahmi.GEOtExcel
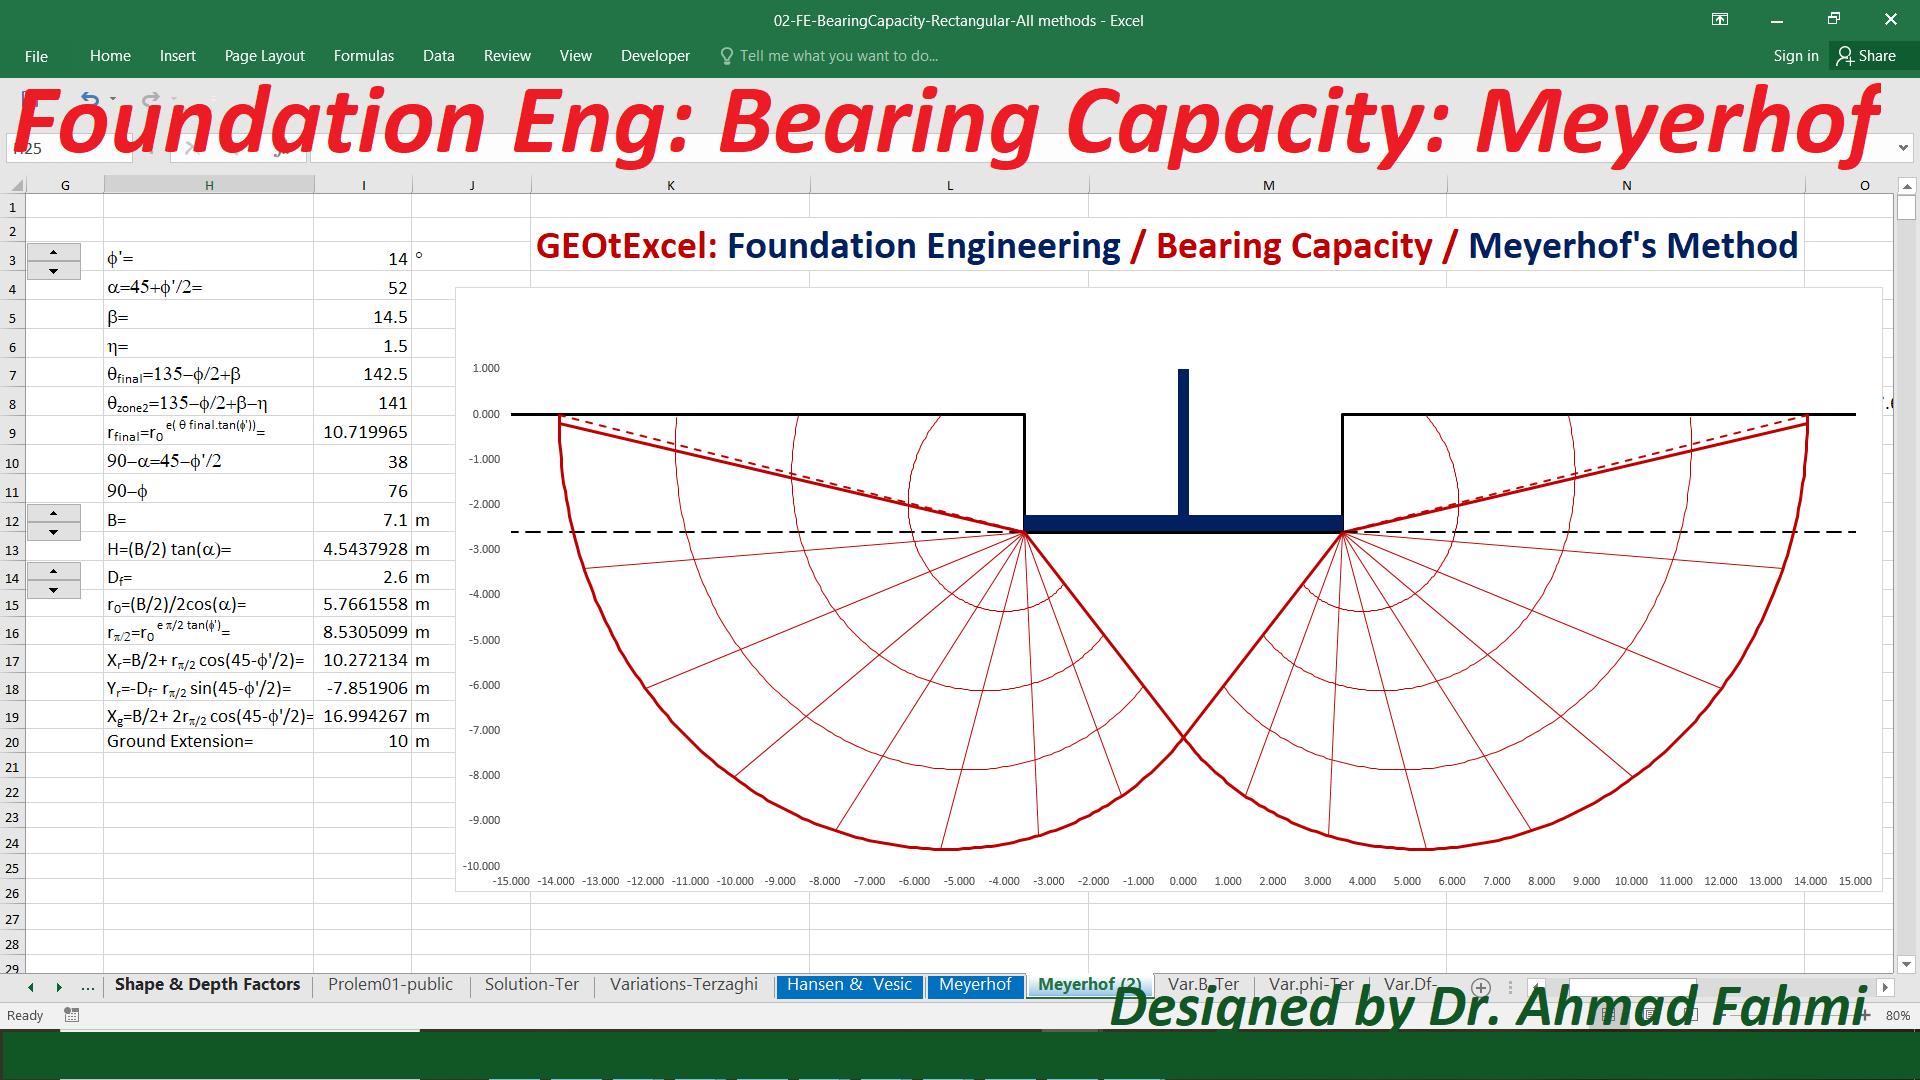
https://www.youtube.com/@Dr.Fahmi.GEOtExcel
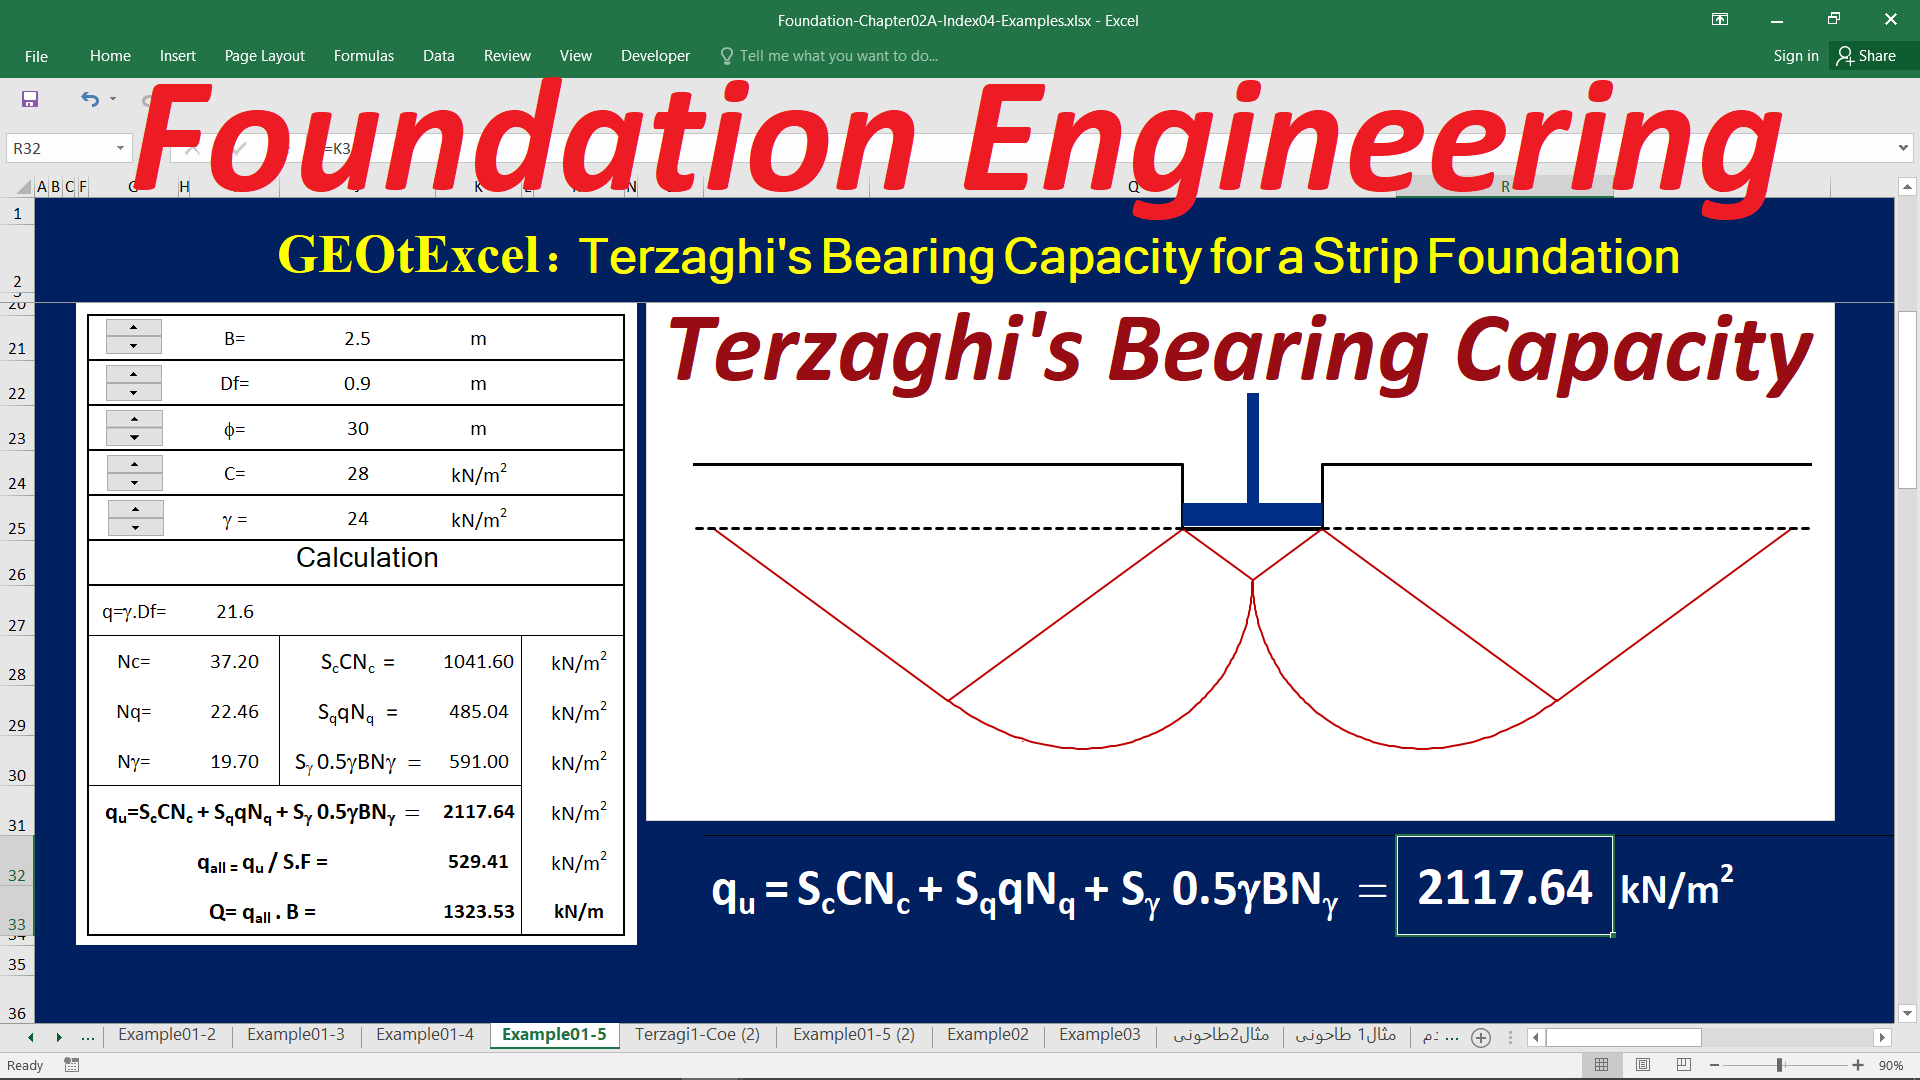
https://www.youtube.com/@Dr.Fahmi.GEOtExcel
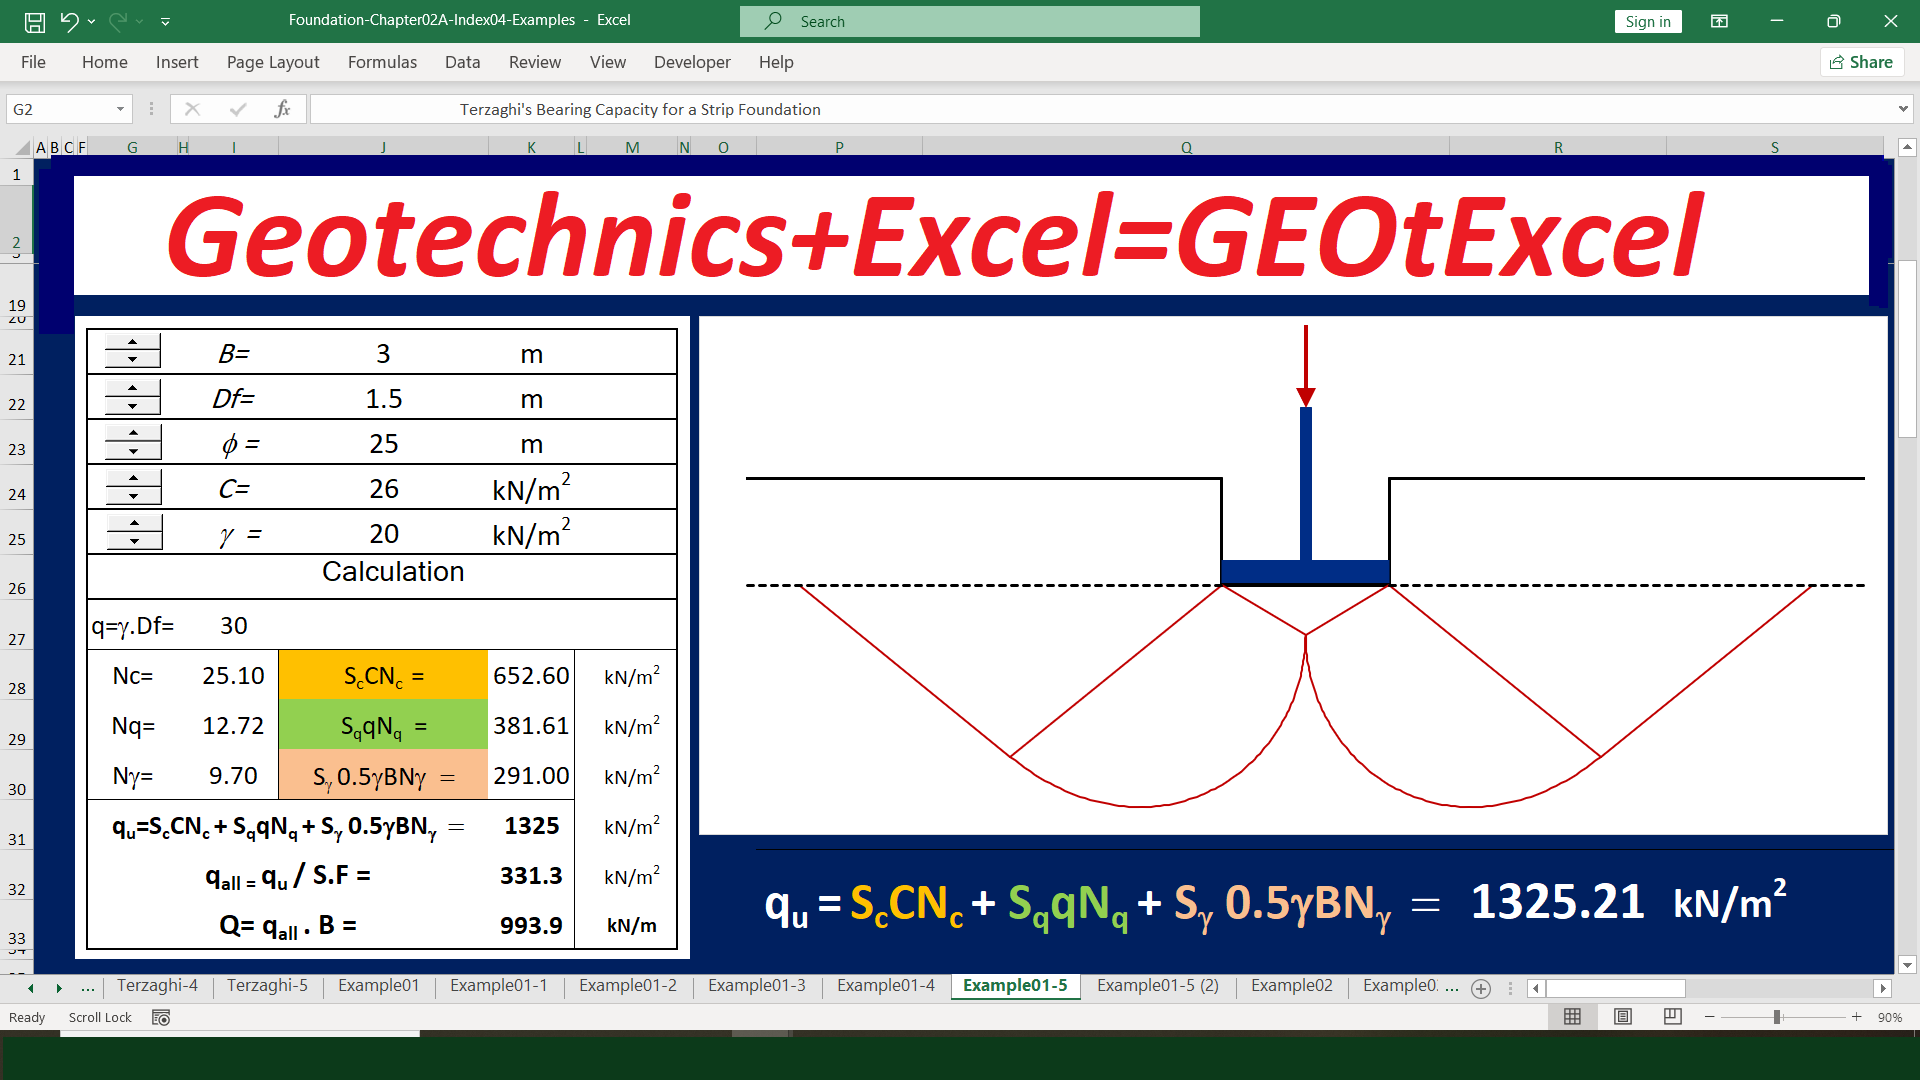
https://www.youtube.com/@Dr.Fahmi.GEOtExcel
https://www.youtube.com/@Dr.Fahmi.GEOtExcel
https://www.youtube.com/@Dr.Fahmi.GEOtExcel

#Soilmechanics #Foundation #Foundationengineering #Foundationdesign #Geotechnics #Geotechnical #Engineering #Excel
Instagram Page Address:
https://www.instagram.com/academy.dr.fahmiExcel Spreadsheets for Soil Mechanics & Foundation Engineering
Geotechnical Excel Programs & Lectures
https://www.youtube.com/@Dr.Fahmi.GEOtExcel
Designed by Dr. Ahmad Fahmi
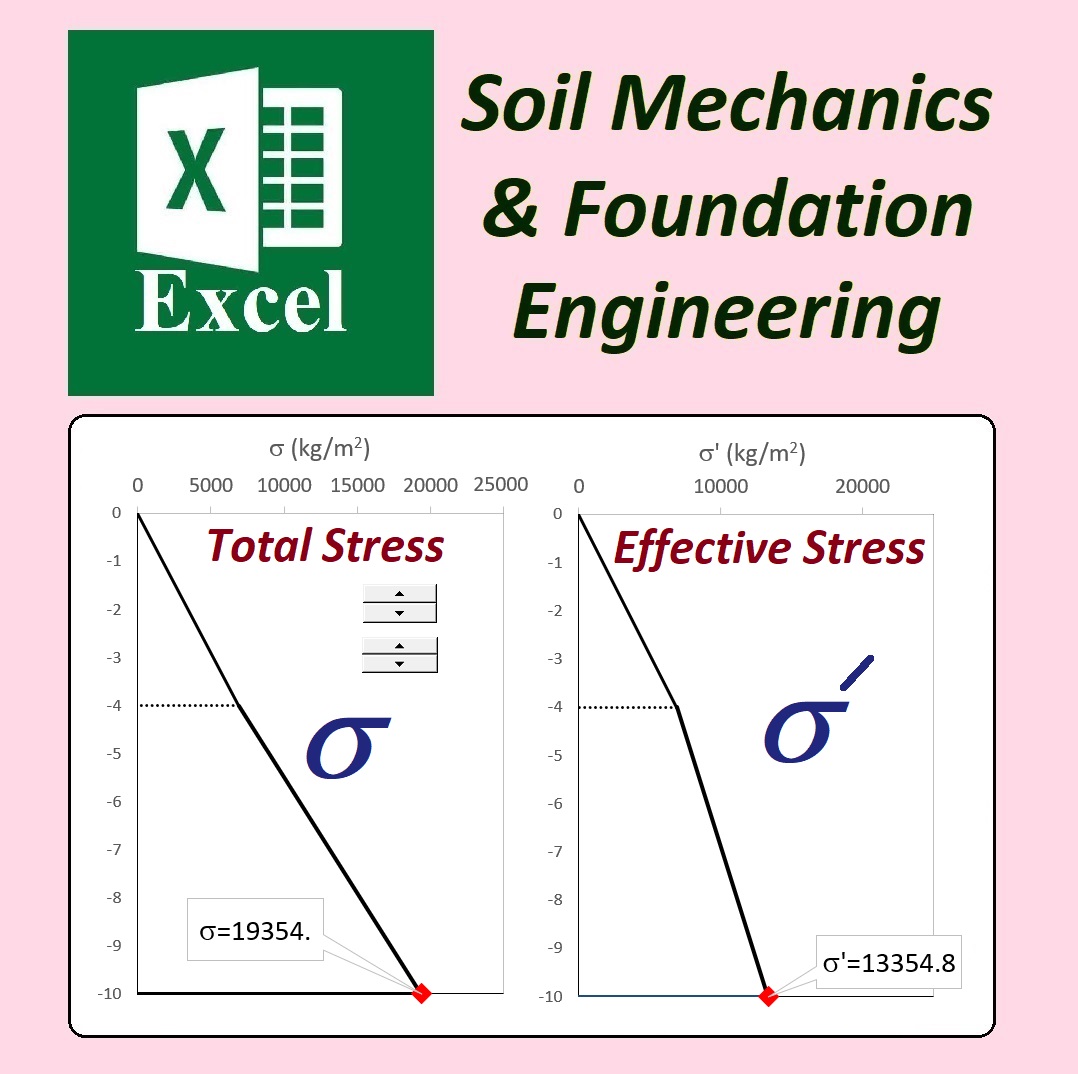
How to Efficiently Calculate Effective Stress, Total Stress, and Pore Water Pressure Using Excel Spreadsheets?
Effective Stress, Total Stress, and Pore Water Pressure Calculation
Watch the Related Videos on Our YouTube Channel (in English)
To efficiently calculate effective stress, total stress, and pore water pressure using Excel spreadsheets, start by organizing your data, such as soil depth, unit weights, and water levels, in a clear and logical layout. Set up separate columns for each input variable to keep the data structured and easy to update. Next, apply Excel functions to calculate total stress based on the depth of the soil and its unit weight, and pore water pressure by considering the water conditions. The effective stress is then determined by subtracting pore water pressure from total stress. Excel’s features like auto-calculation, data validation, and conditional formatting can streamline the process, ensuring accuracy and allowing you to easily modify inputs to explore different scenarios. This setup provides a simple yet powerful tool for performing geotechnical stress analysis.
https://www.youtube.com/@Dr.Fahmi.GEOtExcel
Designed by Dr. Ahmad Fahmi
How is the flow rate through the soil beneath a concrete dam calculated? Excel sheet
How is the flow rate through the soil beneath a concrete dam calculated

Flow rate calculation: Innovative unique Excel Spreadsheet
Watch the video on our YouTube channel
Instagram Page Address
https://www.instagram.com/academy.dr.fahmi/
Excel Spreadsheets for Soil Mechanics & Foundation Engineering
Geotechnical Excel Programs & Lectures
Let's make education a delightful and enriching experience together
https://www.youtube.com/@Dr.Fahmi.GEOtExcel
Calculating the flow rate of water through the soil beneath a concrete dam is crucial for maintaining the dam's stability and safety. This process requires a comprehensive understanding of seepage, which describes how water interacts with and moves through the soil. Using an Excel spreadsheet, you can streamline the calculation by inputting soil properties (such as permeability), hydraulic gradients, and cross-sectional areas to compute the flow rate through Darcy's Law. Excel’s formulas and data visualization tools allow for clear graphical representation of seepage calculations.
Designed by Dr. Ahmad Fahmi
#GEOtExcel #soilmechanics #excelspreadsheets #geotechnics #geotechnicalengineering #soil_mechanics #excel #excelsheet #shearstress #microsoftexcel
How can soil particle size be graphically represented in Microsoft Excel?
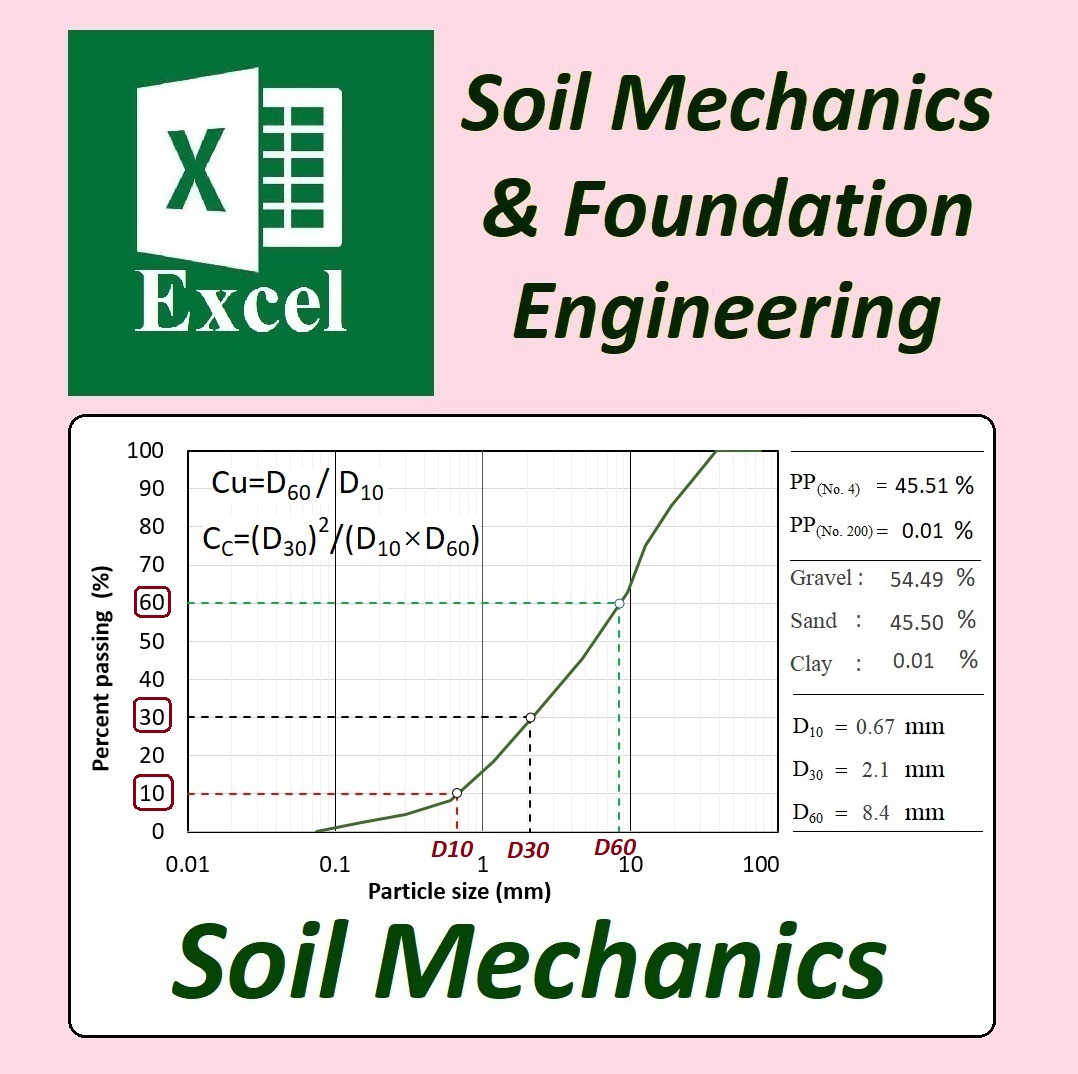
Soil particle size distribution can be effectively represented graphically in Microsoft Excel by plotting a gradation curve, which helps visualize the range of particle sizes within a soil sample. To do this, data from sieve analysis or hydrometer tests are first entered into an Excel spreadsheet. The key data points typically include the percentage of soil passing through each sieve (cumulative percent finer) and the corresponding sieve sizes. Using this data, you can create a scatter or line chart in Excel, with the sieve size (or particle diameter in mm) plotted on a logarithmic scale on the x-axis and the cumulative percent finer on the y-axis. Excel’s chart tools allow you to format the axes, add labels, and generate a smooth curve that shows the particle size distribution of the soil sample. This graphical representation helps in classifying the soil based on its gradation characteristics, such as identifying whether it is well-graded, poorly graded, or uniformly graded. Excel's flexibility in data manipulation and visualization makes it a convenient tool for engineers to represent and analyze soil particle size distribution.
https://www.youtube.com/@Dr.Fahmi.GEOtExcel
Designed by Dr. Ahmad Fahmi