Soil Mechanics and Foundation Engineering/ Dr. Ahmad Fahmi / Professional Excel Spreadsheet Designer
In the name of God /Dr. Ahmad Fahmi's WeblogSoil Mechanics and Foundation Engineering/ Dr. Ahmad Fahmi / Professional Excel Spreadsheet Designer
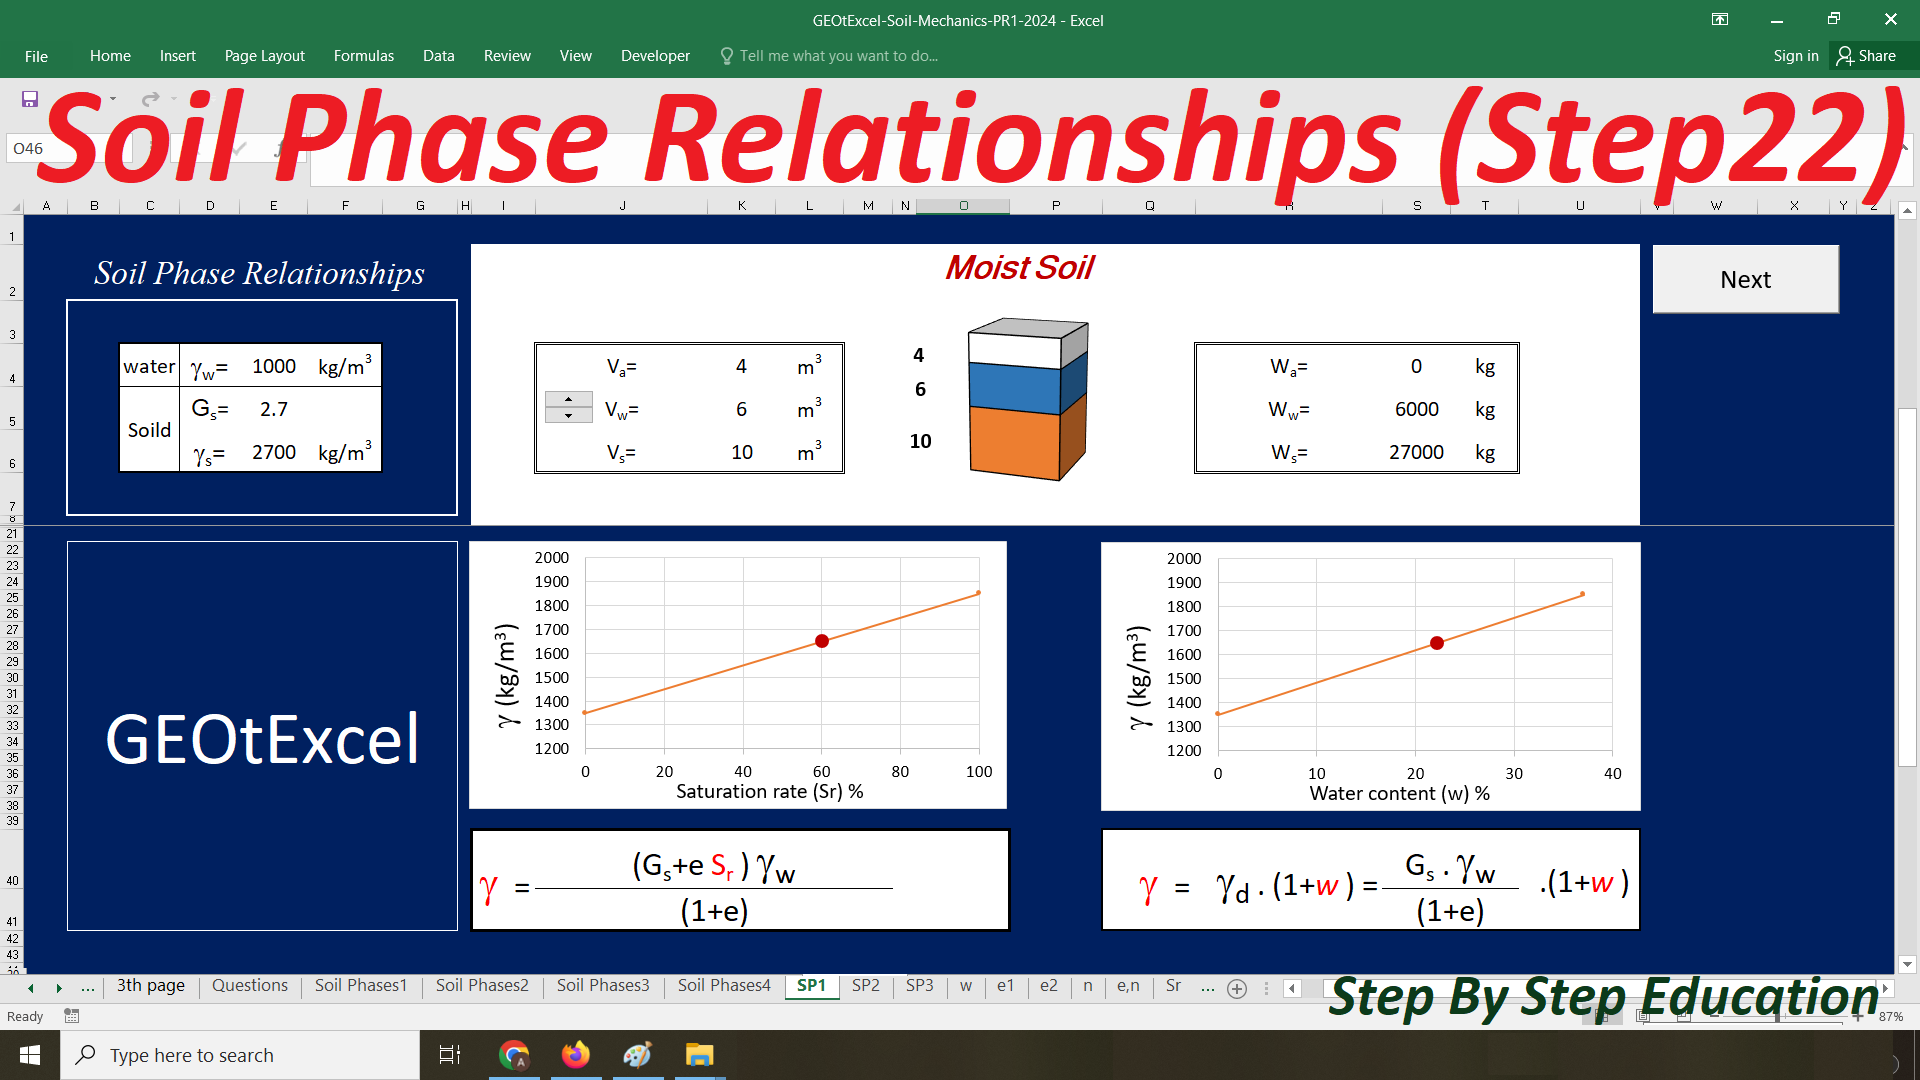
In the name of God /Dr. Ahmad Fahmi's WeblogSoil Phase Relationships
Soil Mechanics Lecture
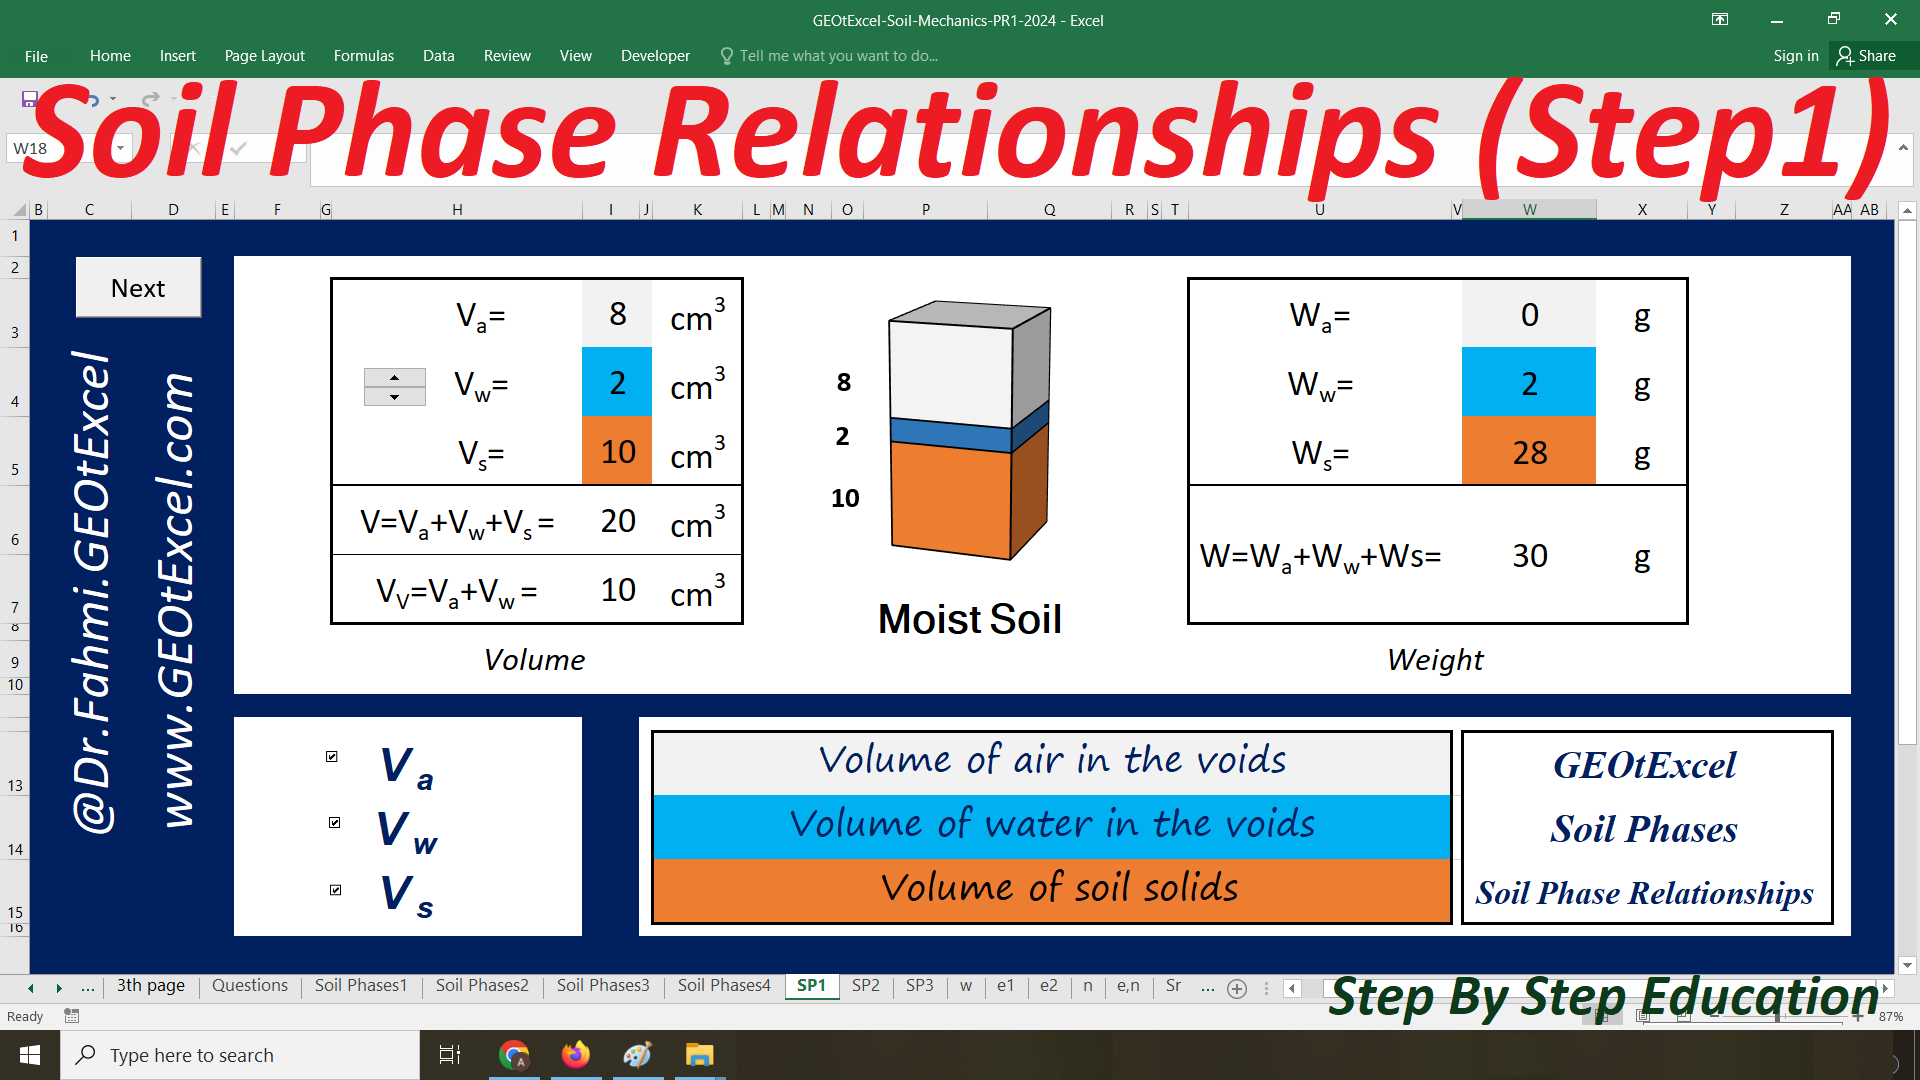
Soil phase relationships describe how solids, water, and air coexist in a given volume of soil and are essential in understanding soil behavior. These relationships are crucial for assessing characteristics like density, porosity, saturation rate, and moisture content, all of which directly impact soil’s engineering performance. By examining the proportions of solids, water, and air, engineers can determine how well the soil can support loads, retain moisture, or drain. Soil that is fully saturated has no air voids, while partially saturated soils contain both air and water within their void spaces. These relationships offer insights into soil's stability, compressibility, and permeability, which are necessary for effective design in construction and environmental applications.
Watch the Related Videos on Our YouTube Channel (in English):
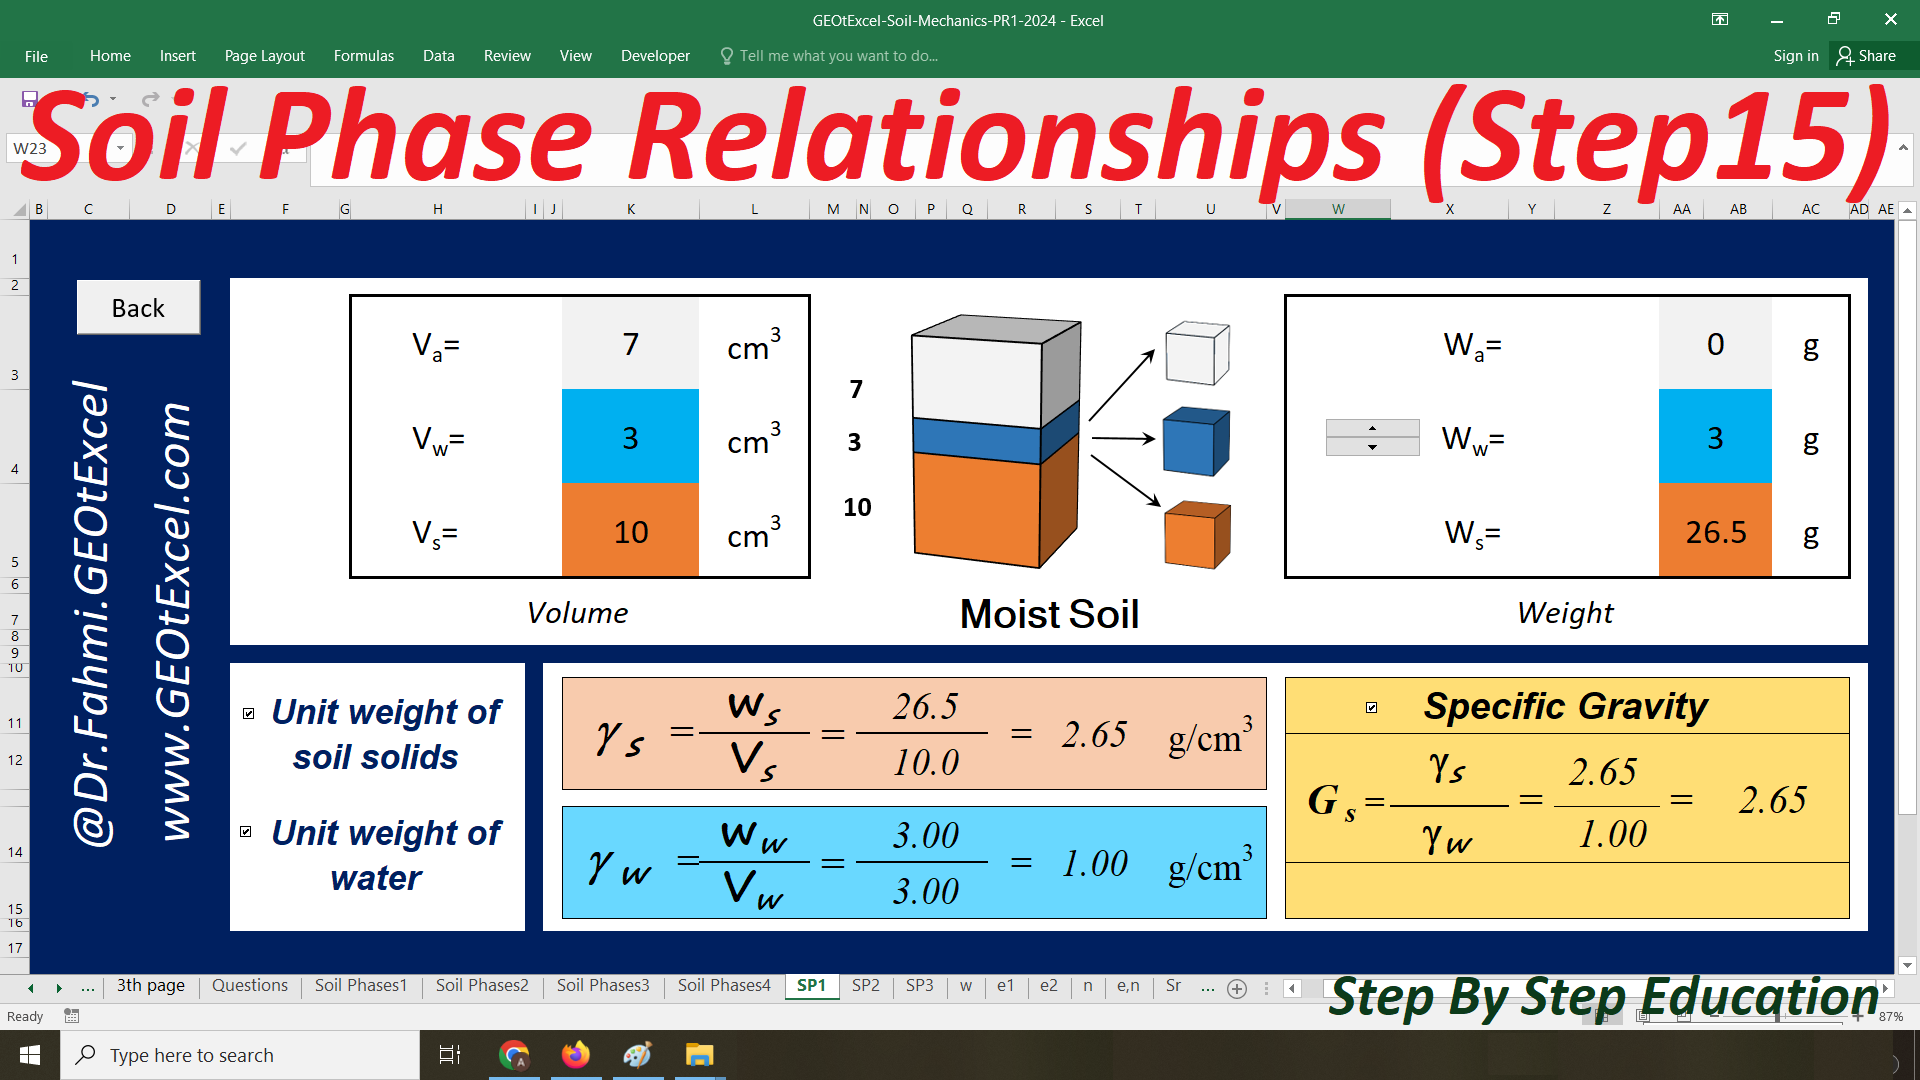
Volume of air in the voids
Volume of water in the voids
Volume of soil solids
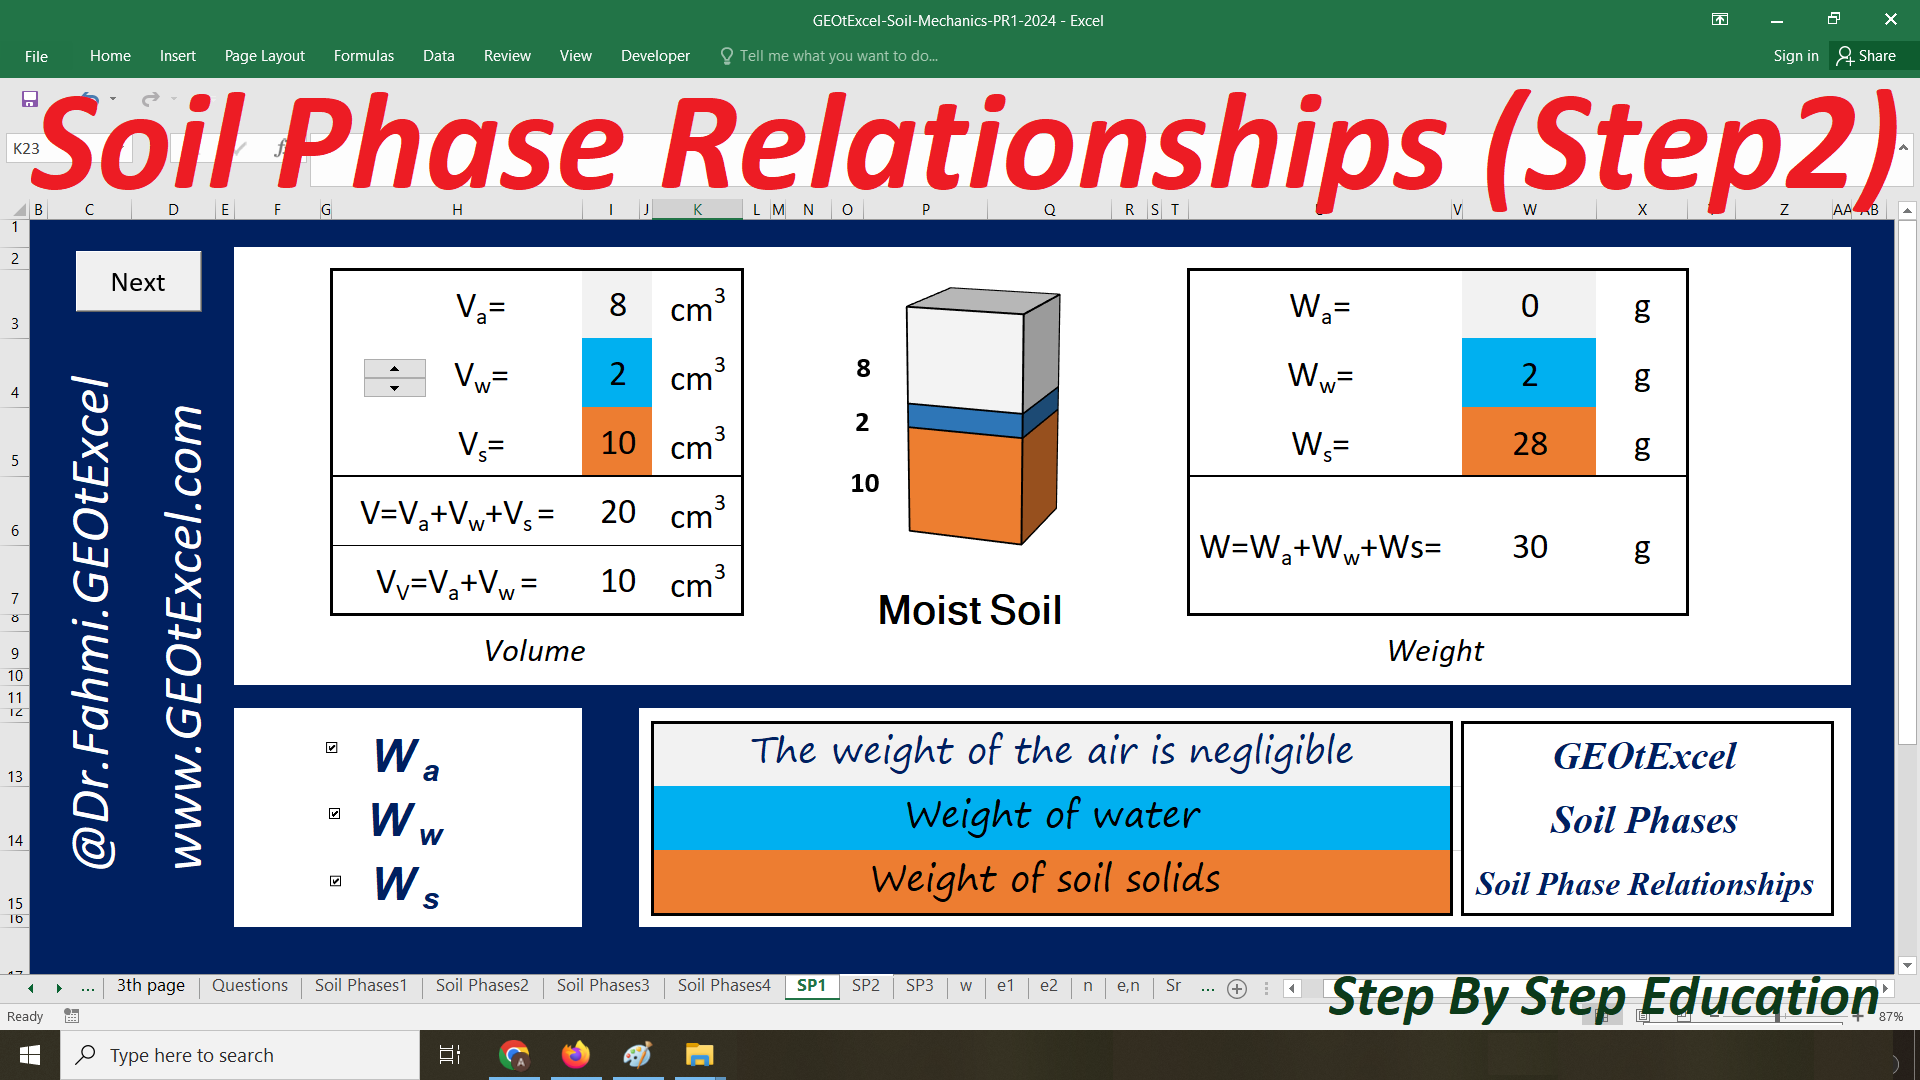
The weight of the air is negligible
Weight of water
Weight of soil solids
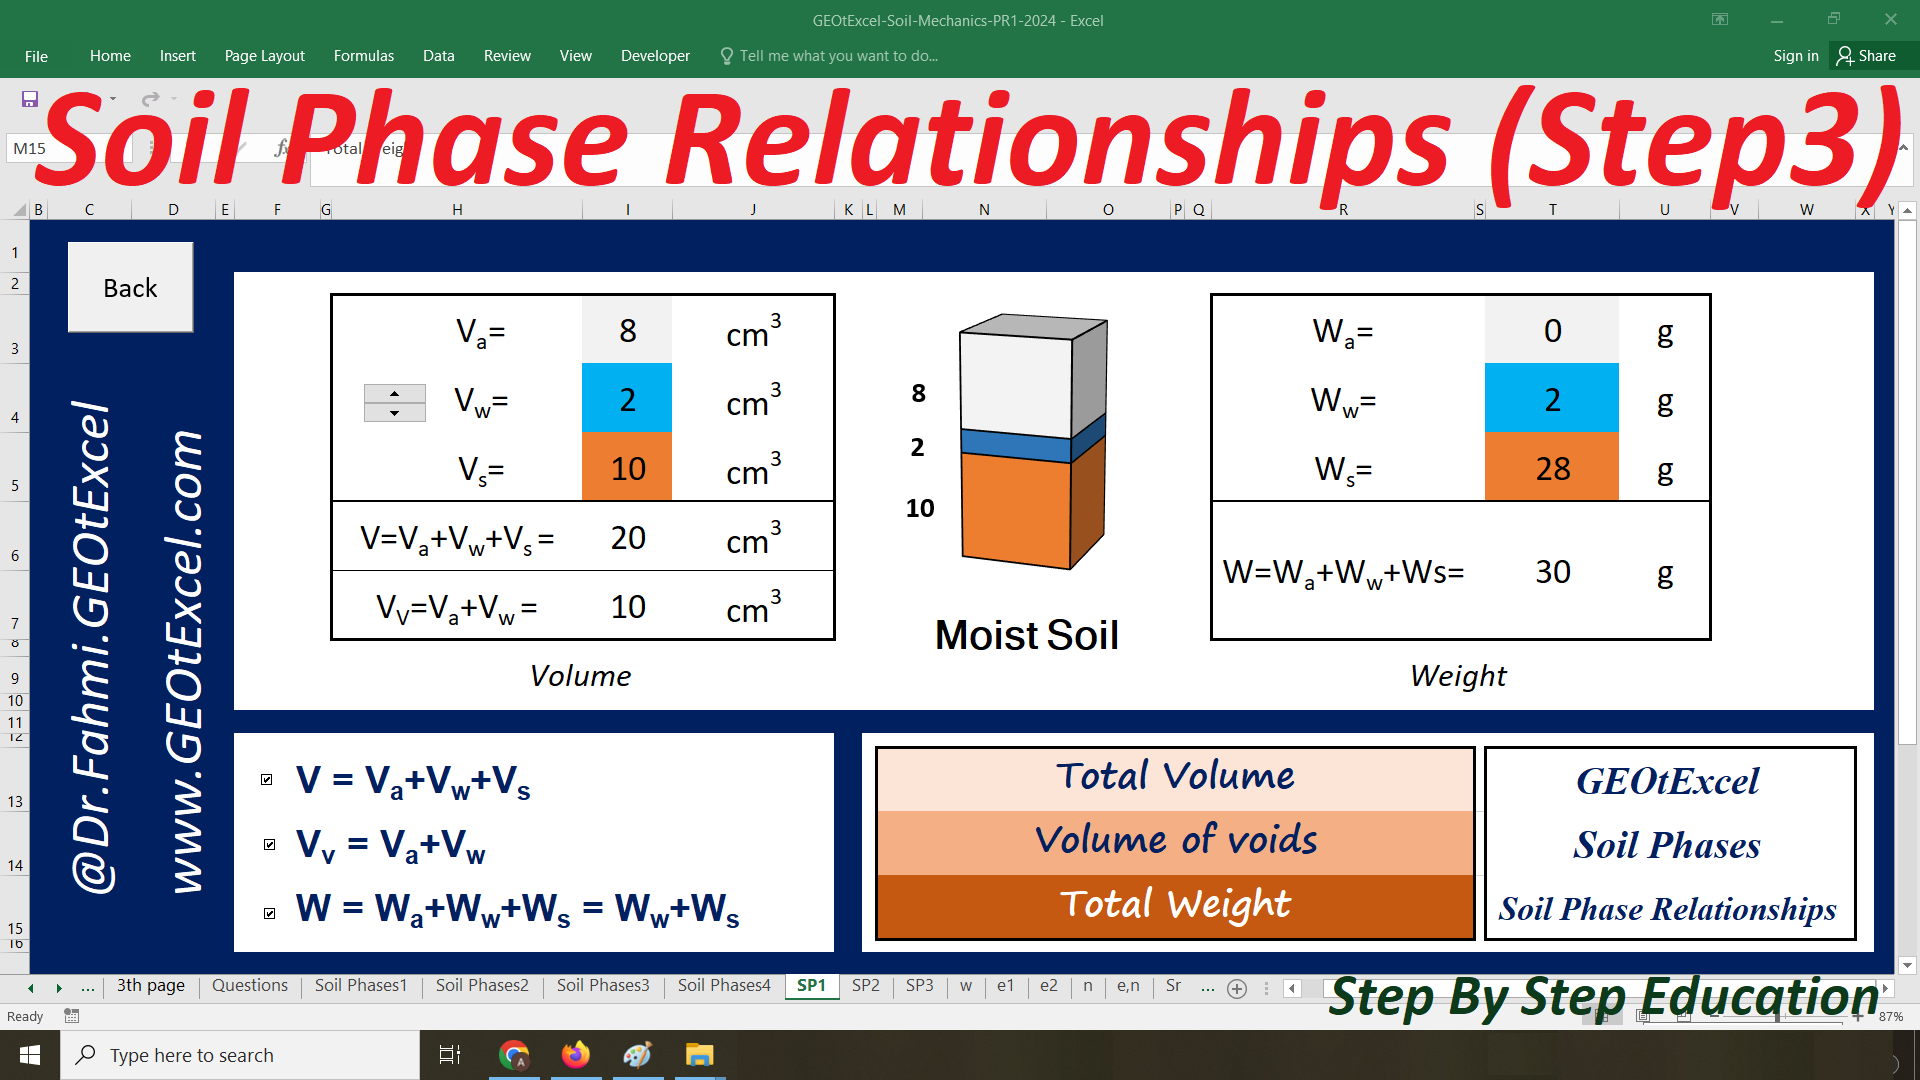
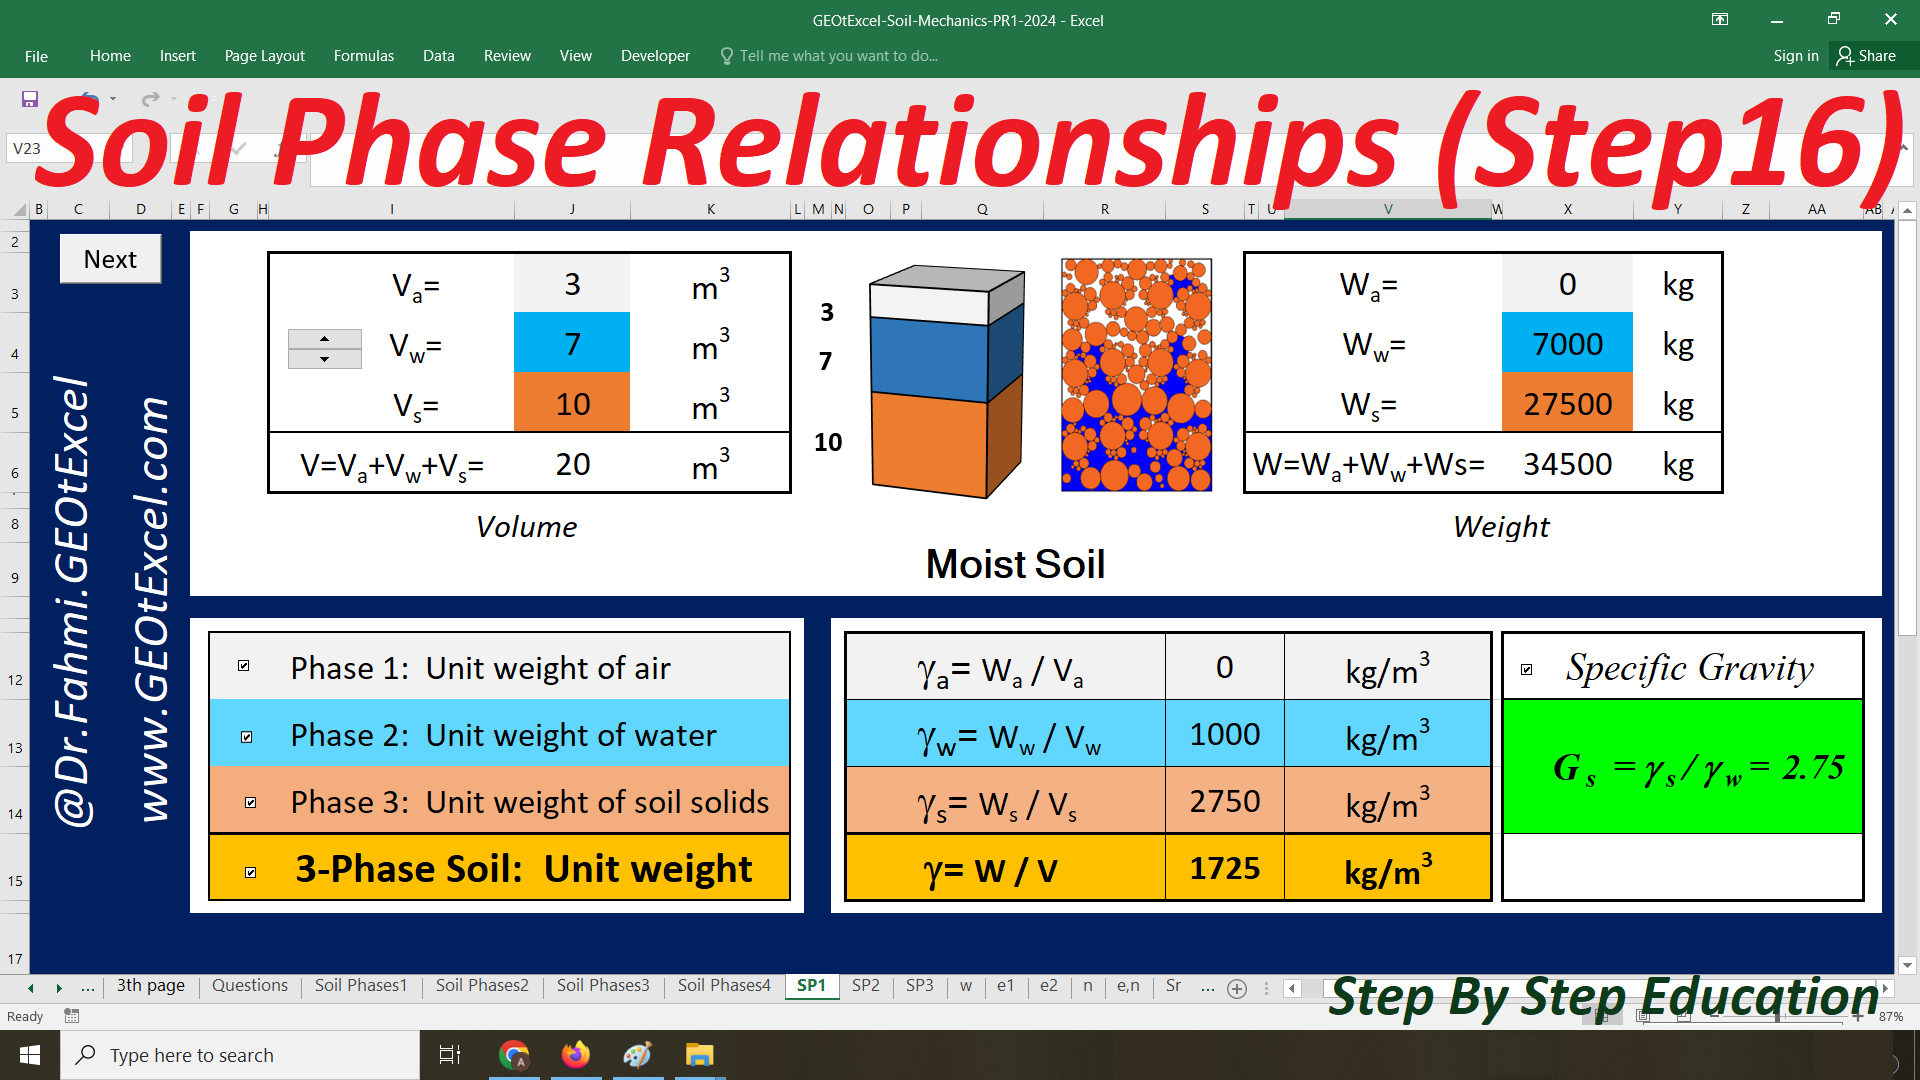
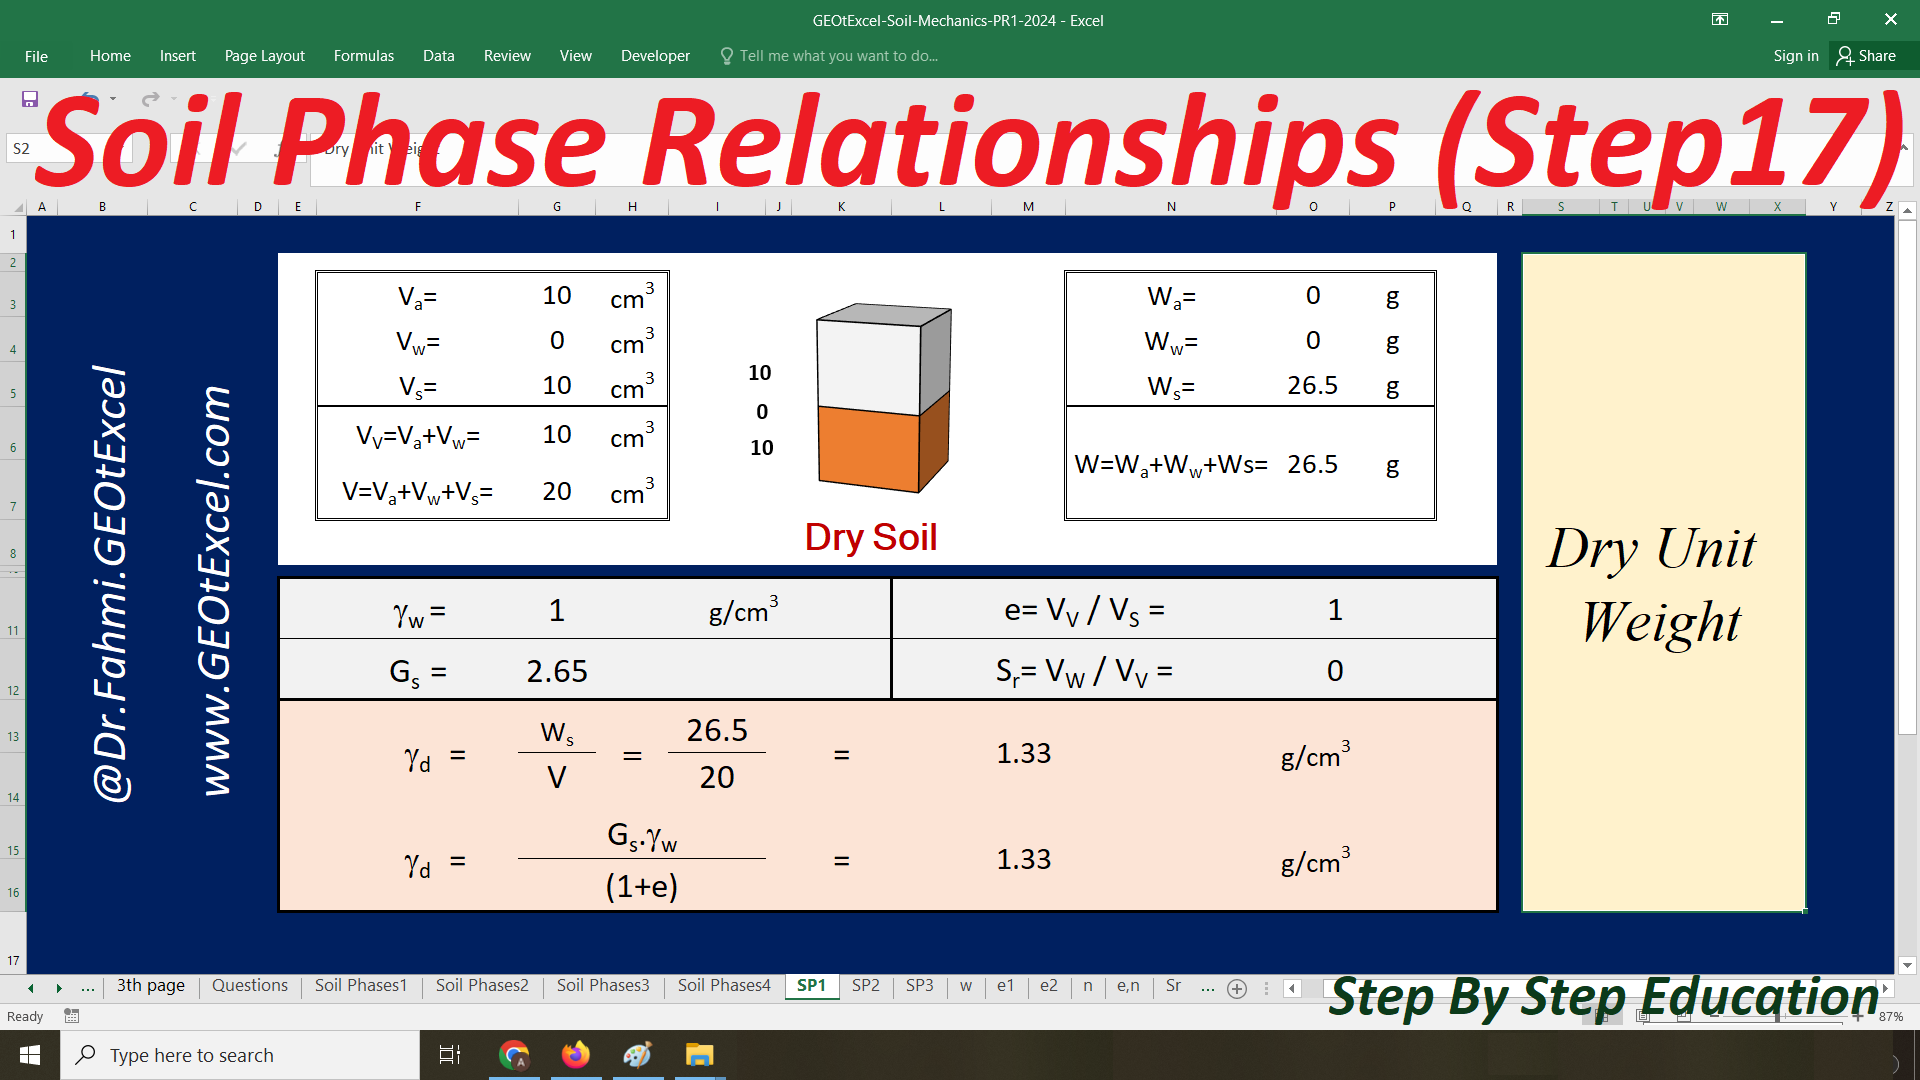
Total Volume
Volume of voids
Total Weight
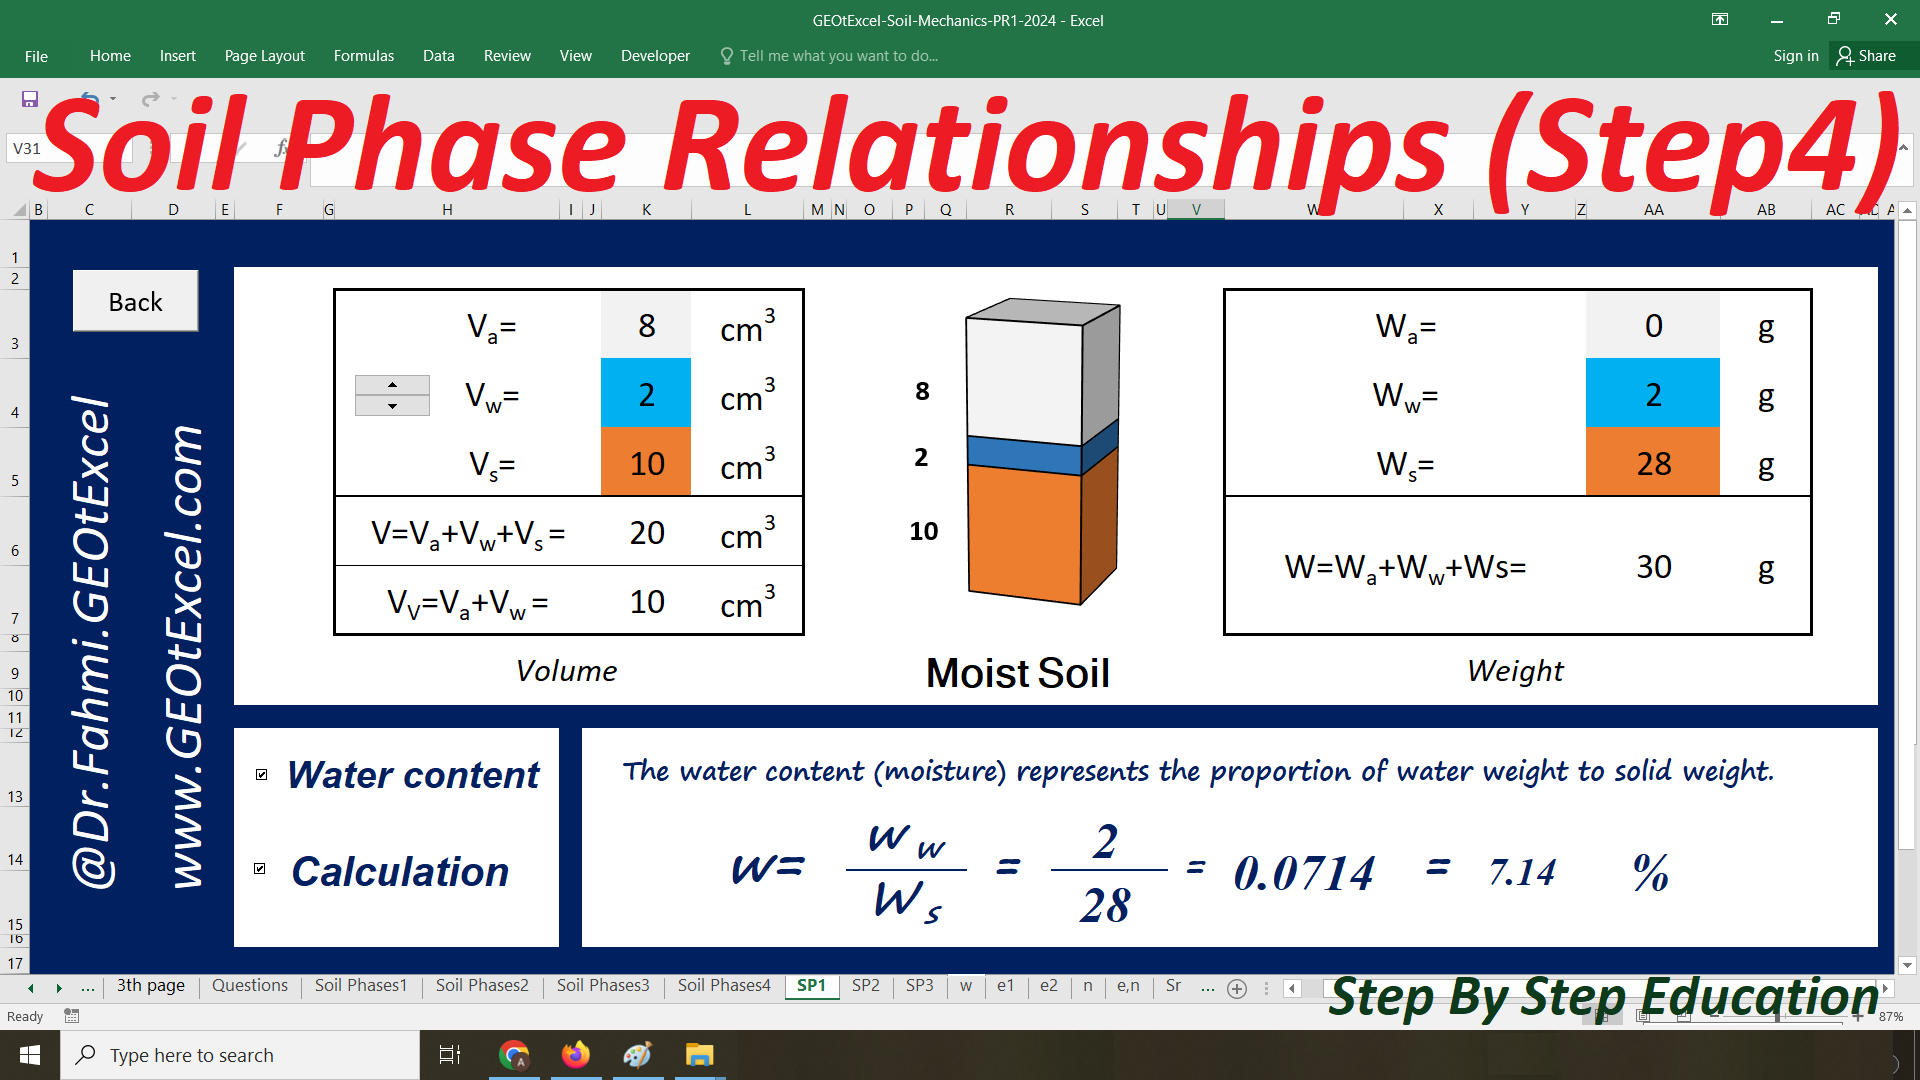
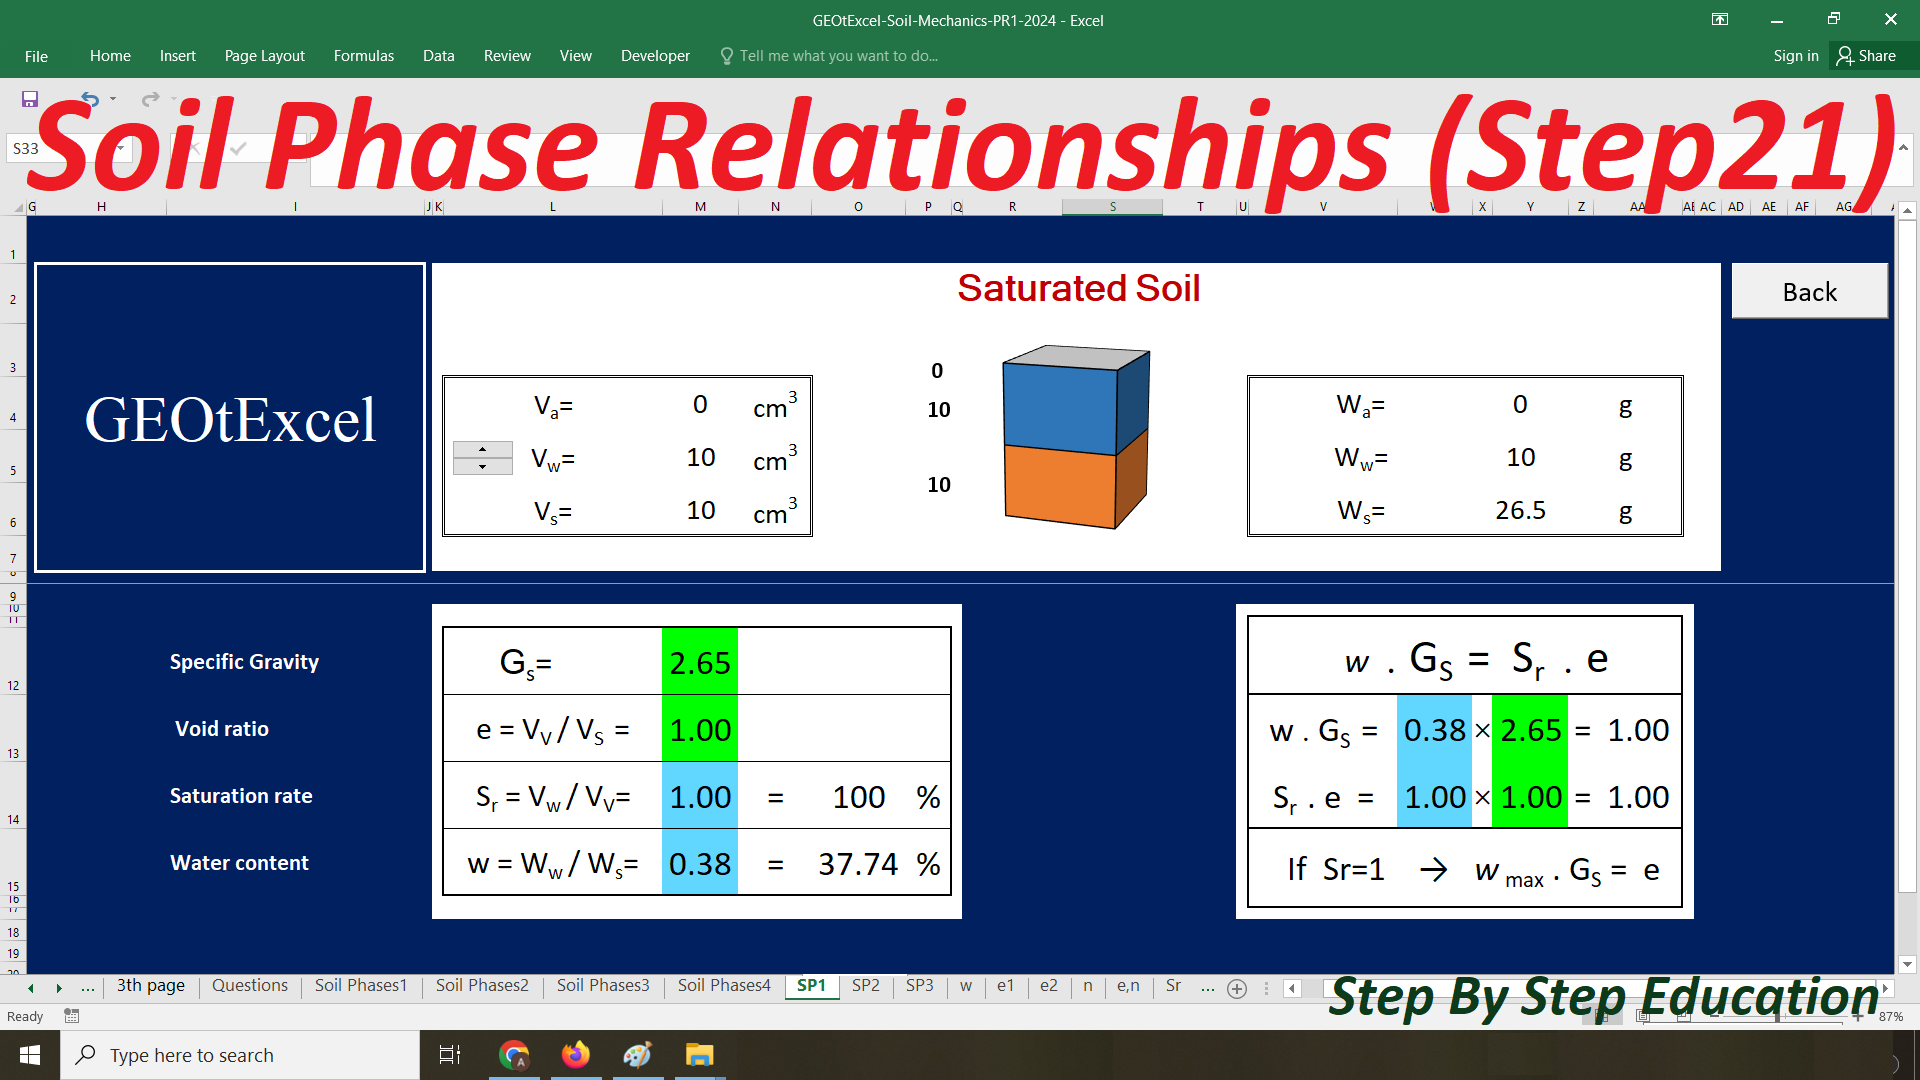
The water content (moisture) represents the proportion of water weight to solid weight
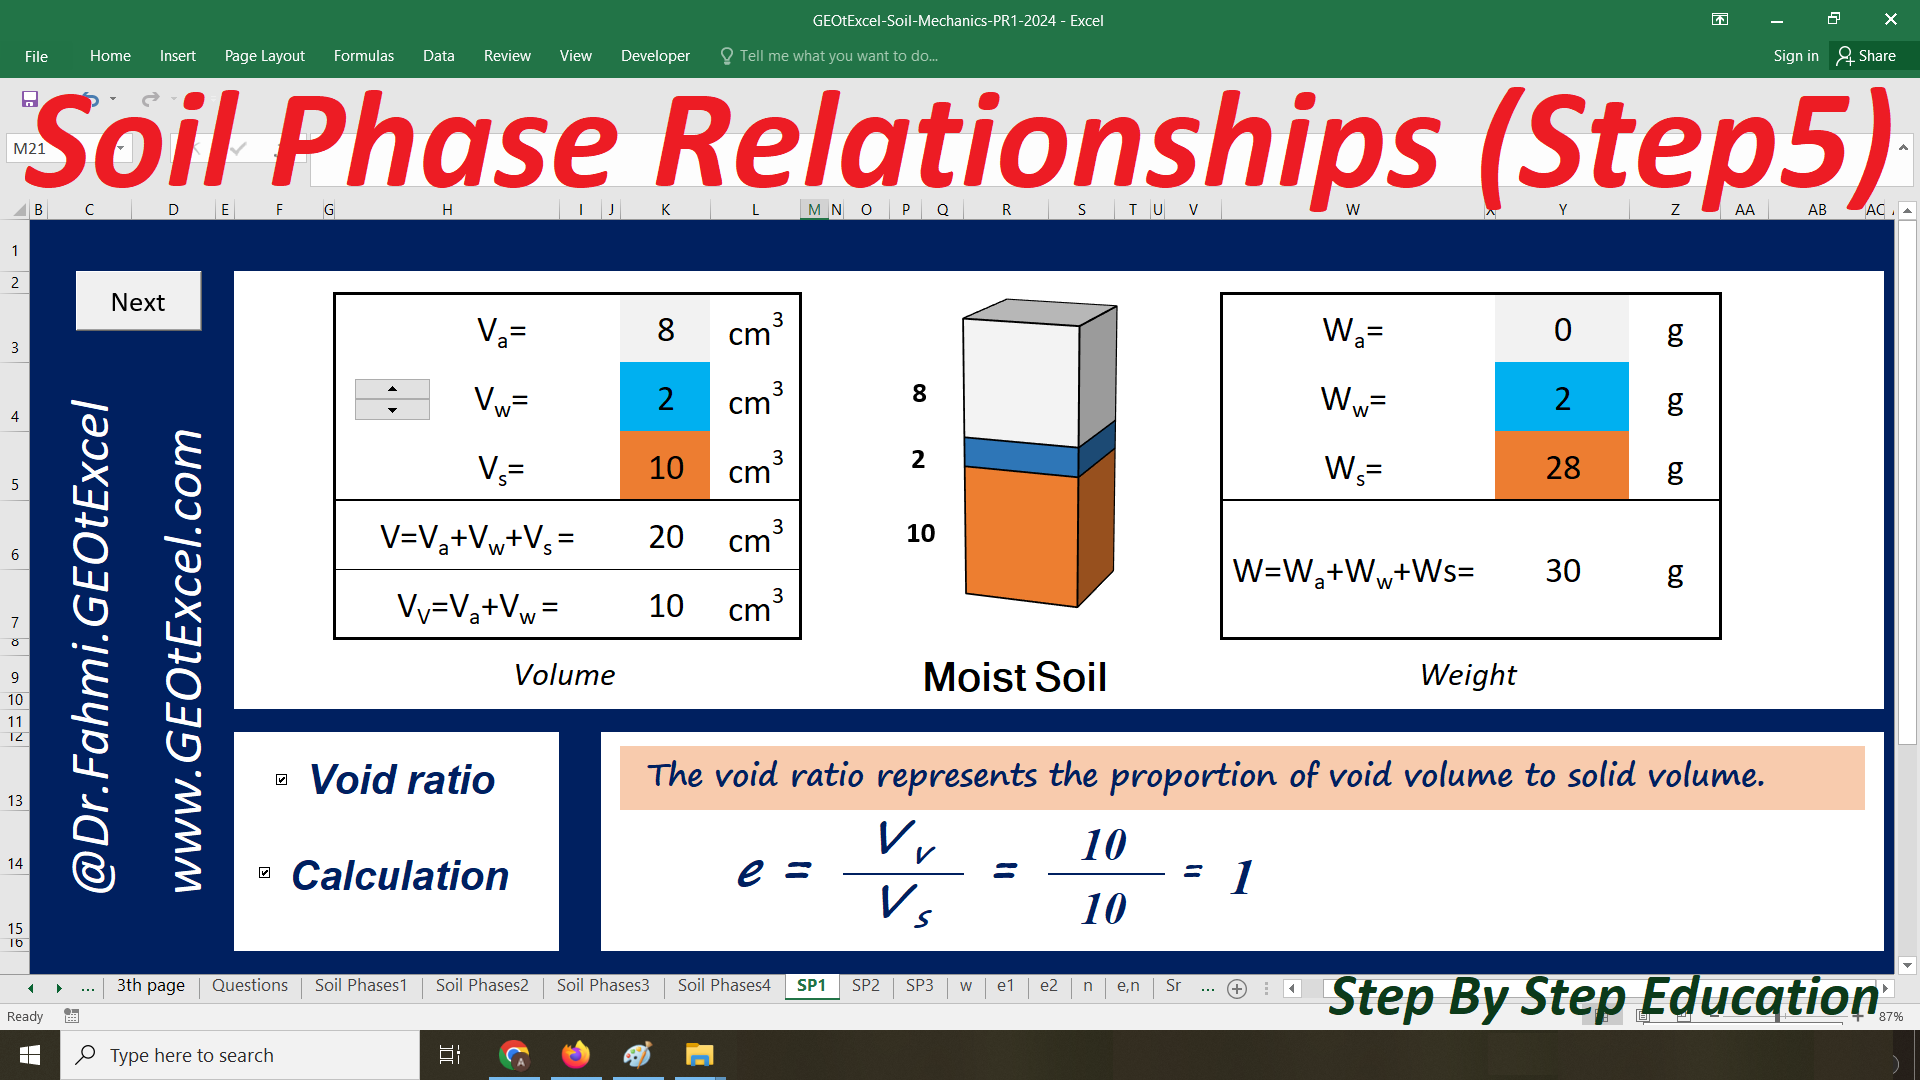
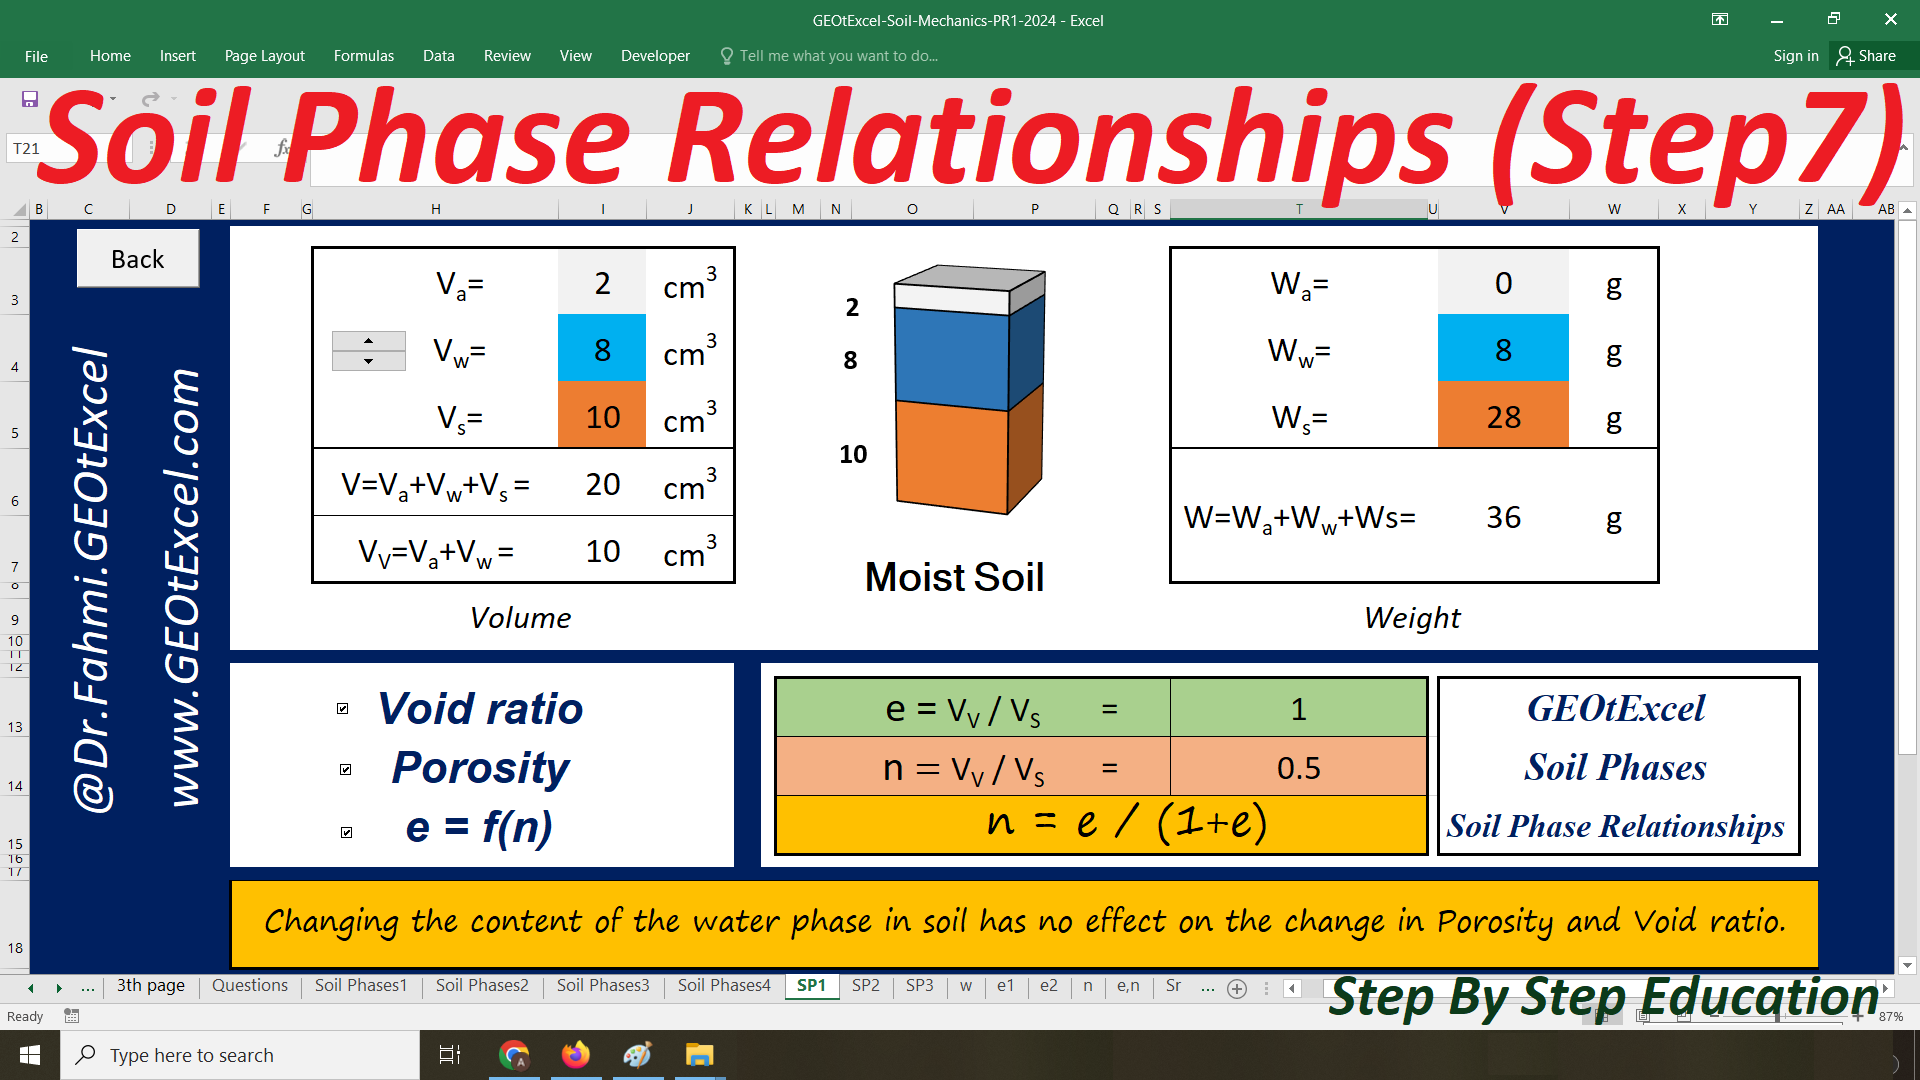
The void ratio represents the proportion of void volume to solid volume
The porosity represents the proportion of void volume to total volume
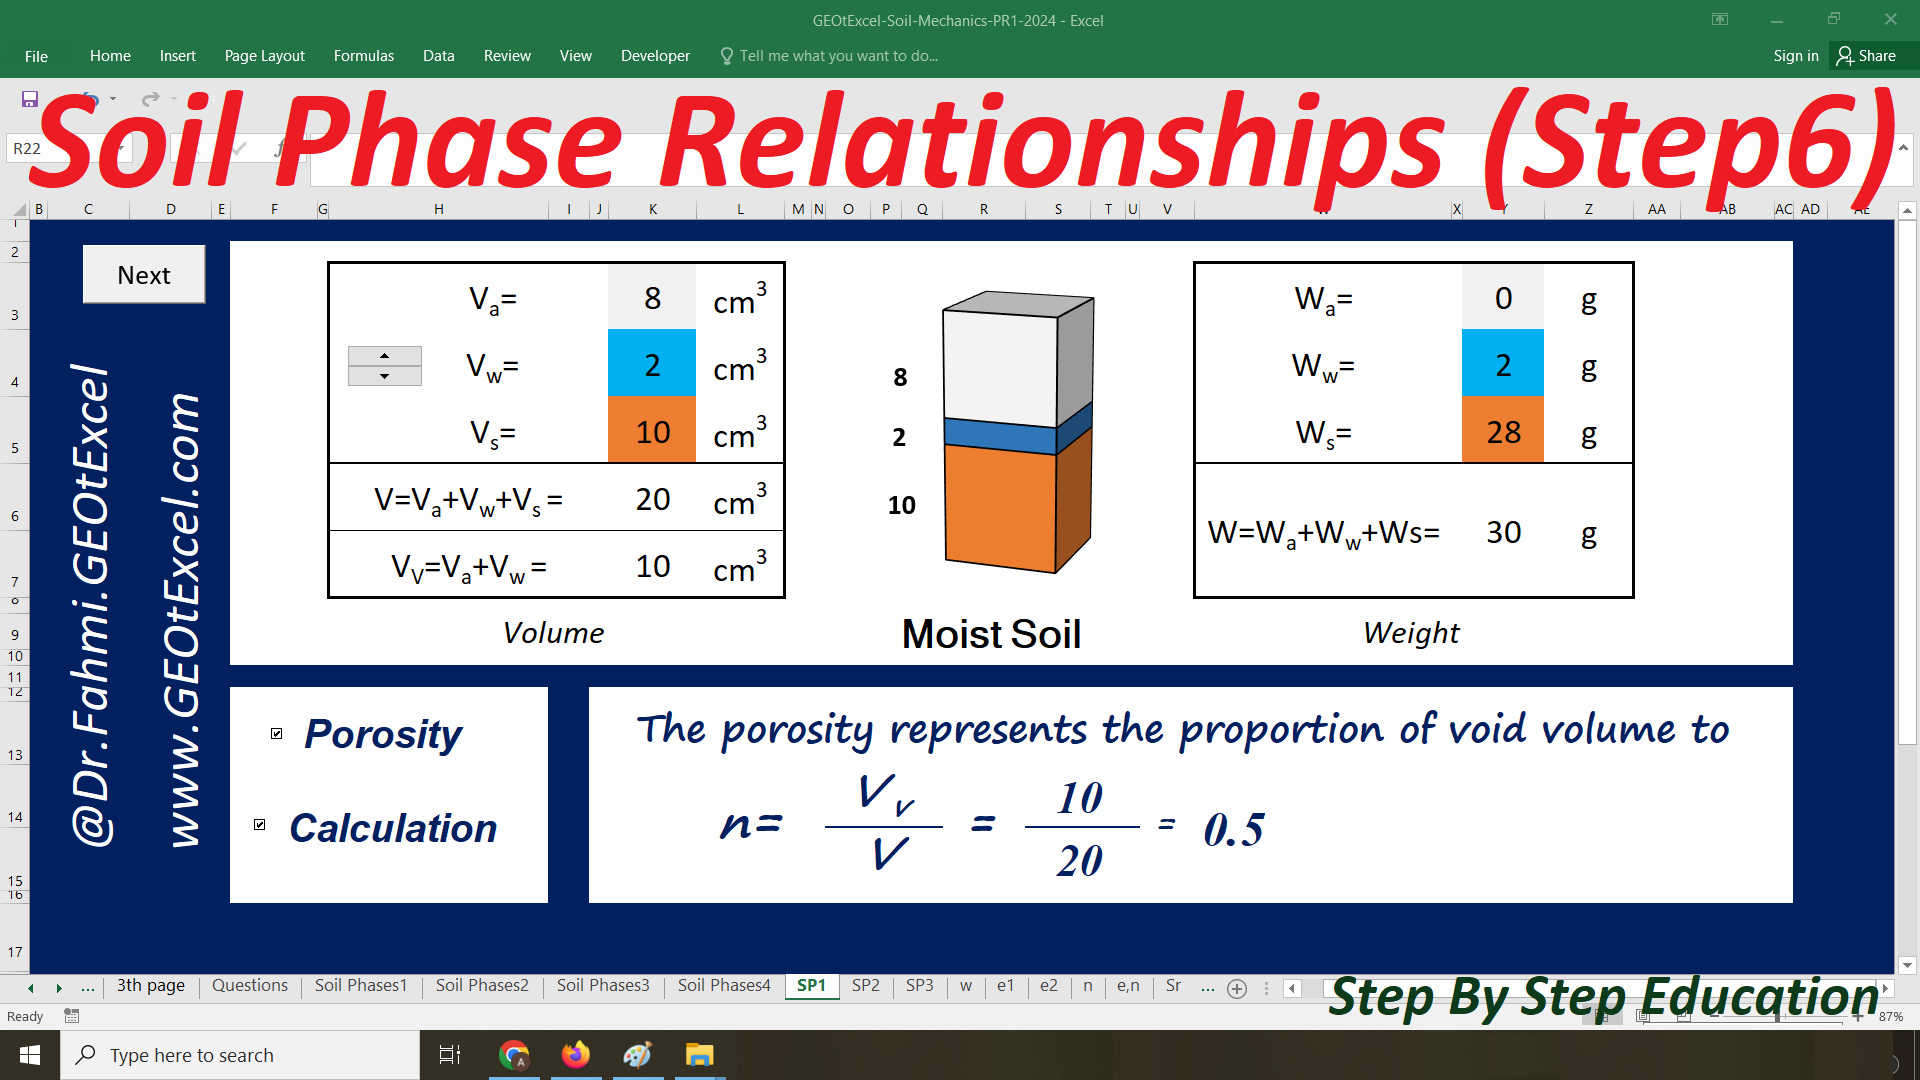
The porosity represents the proportion of void volume to total volume
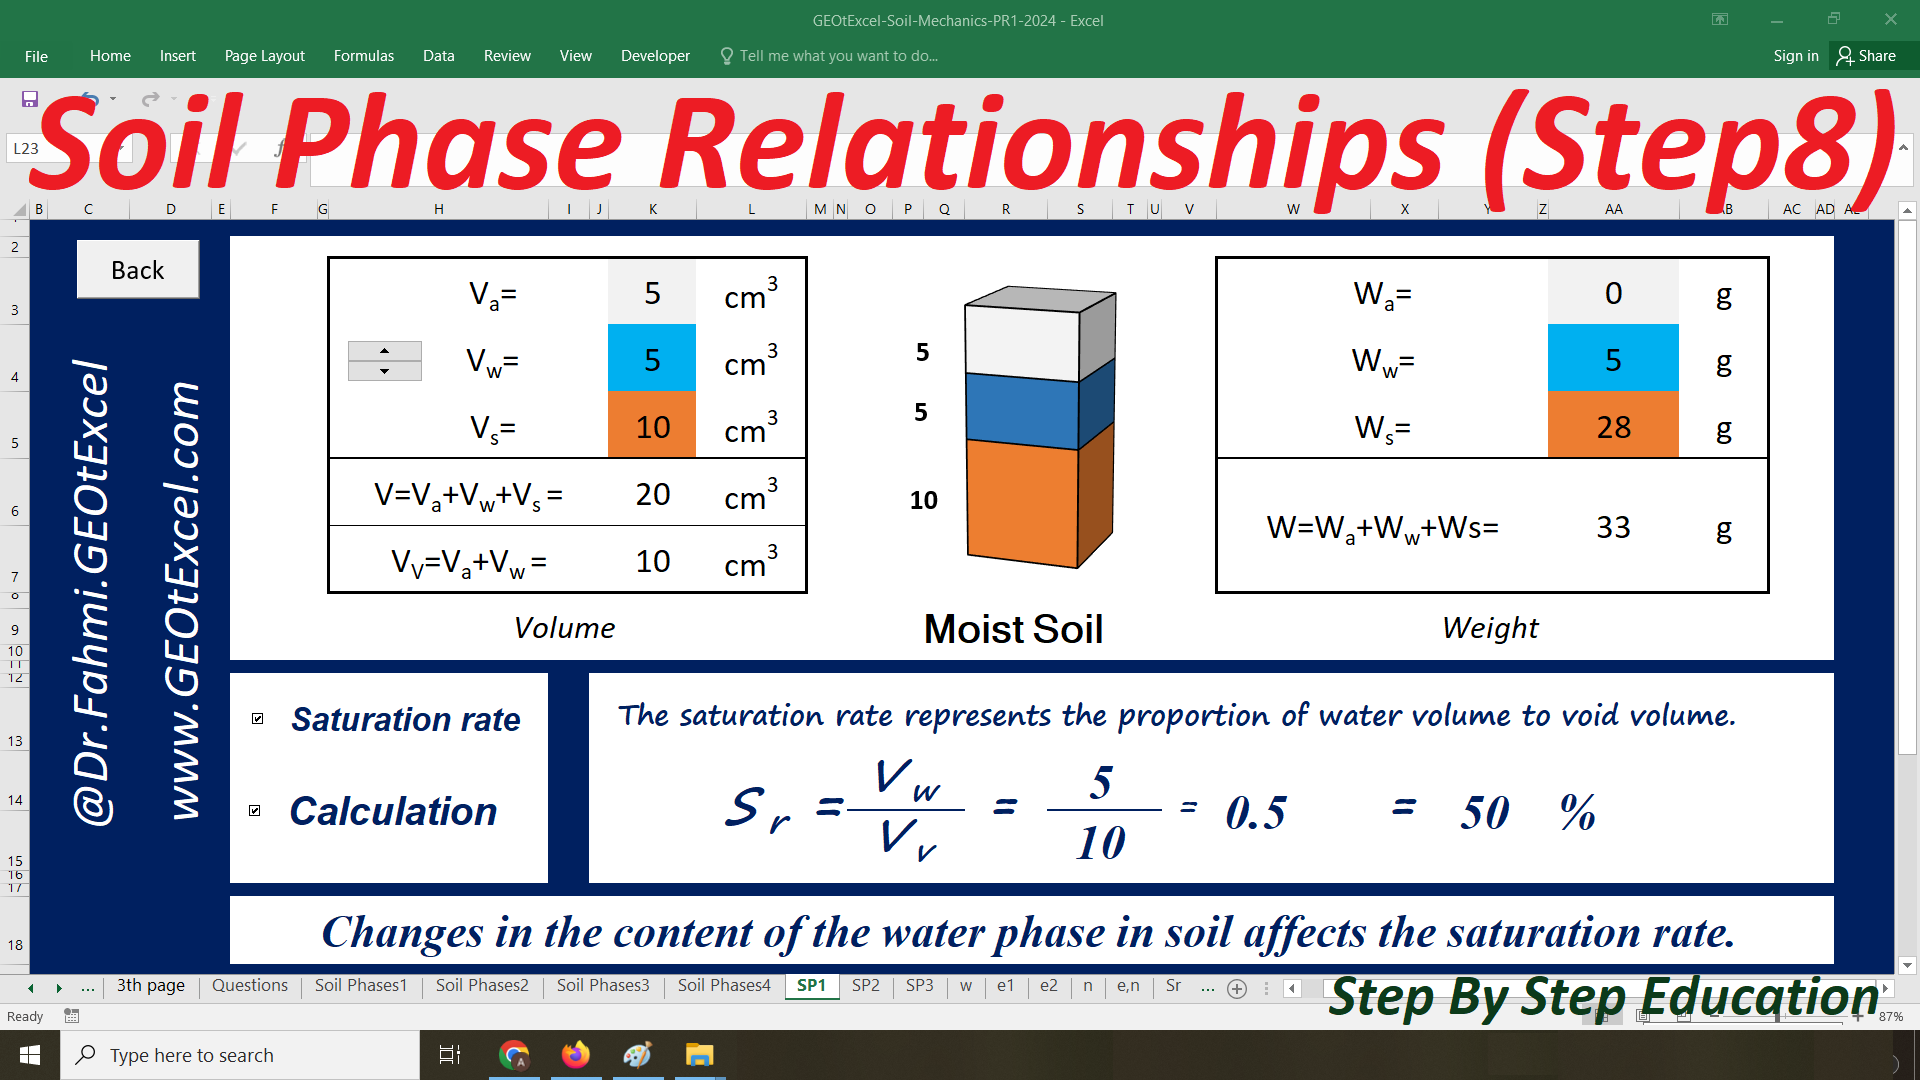
The saturation rate represents the proportion of water volume to void volume
The air content represents the proportion of air volume to void volume

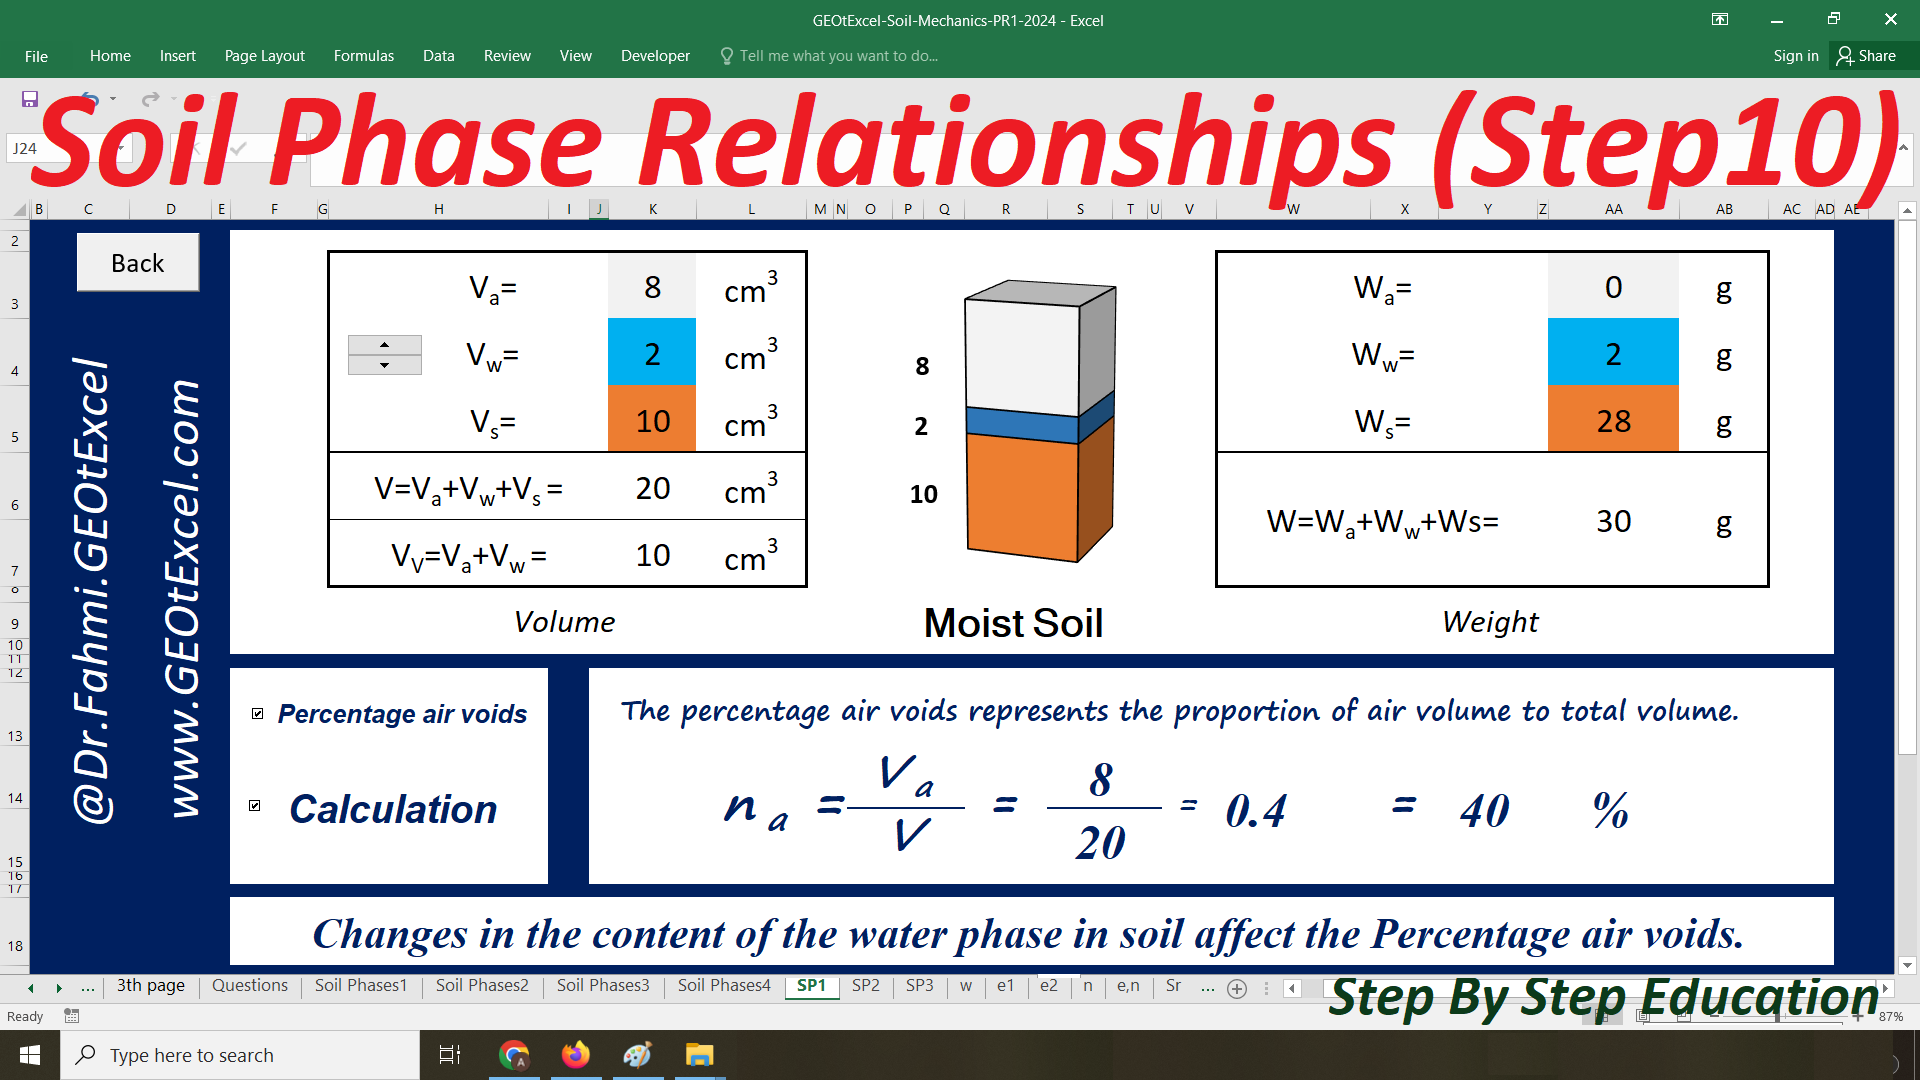
The percentage air voids represents the proportion of air volume to total volume
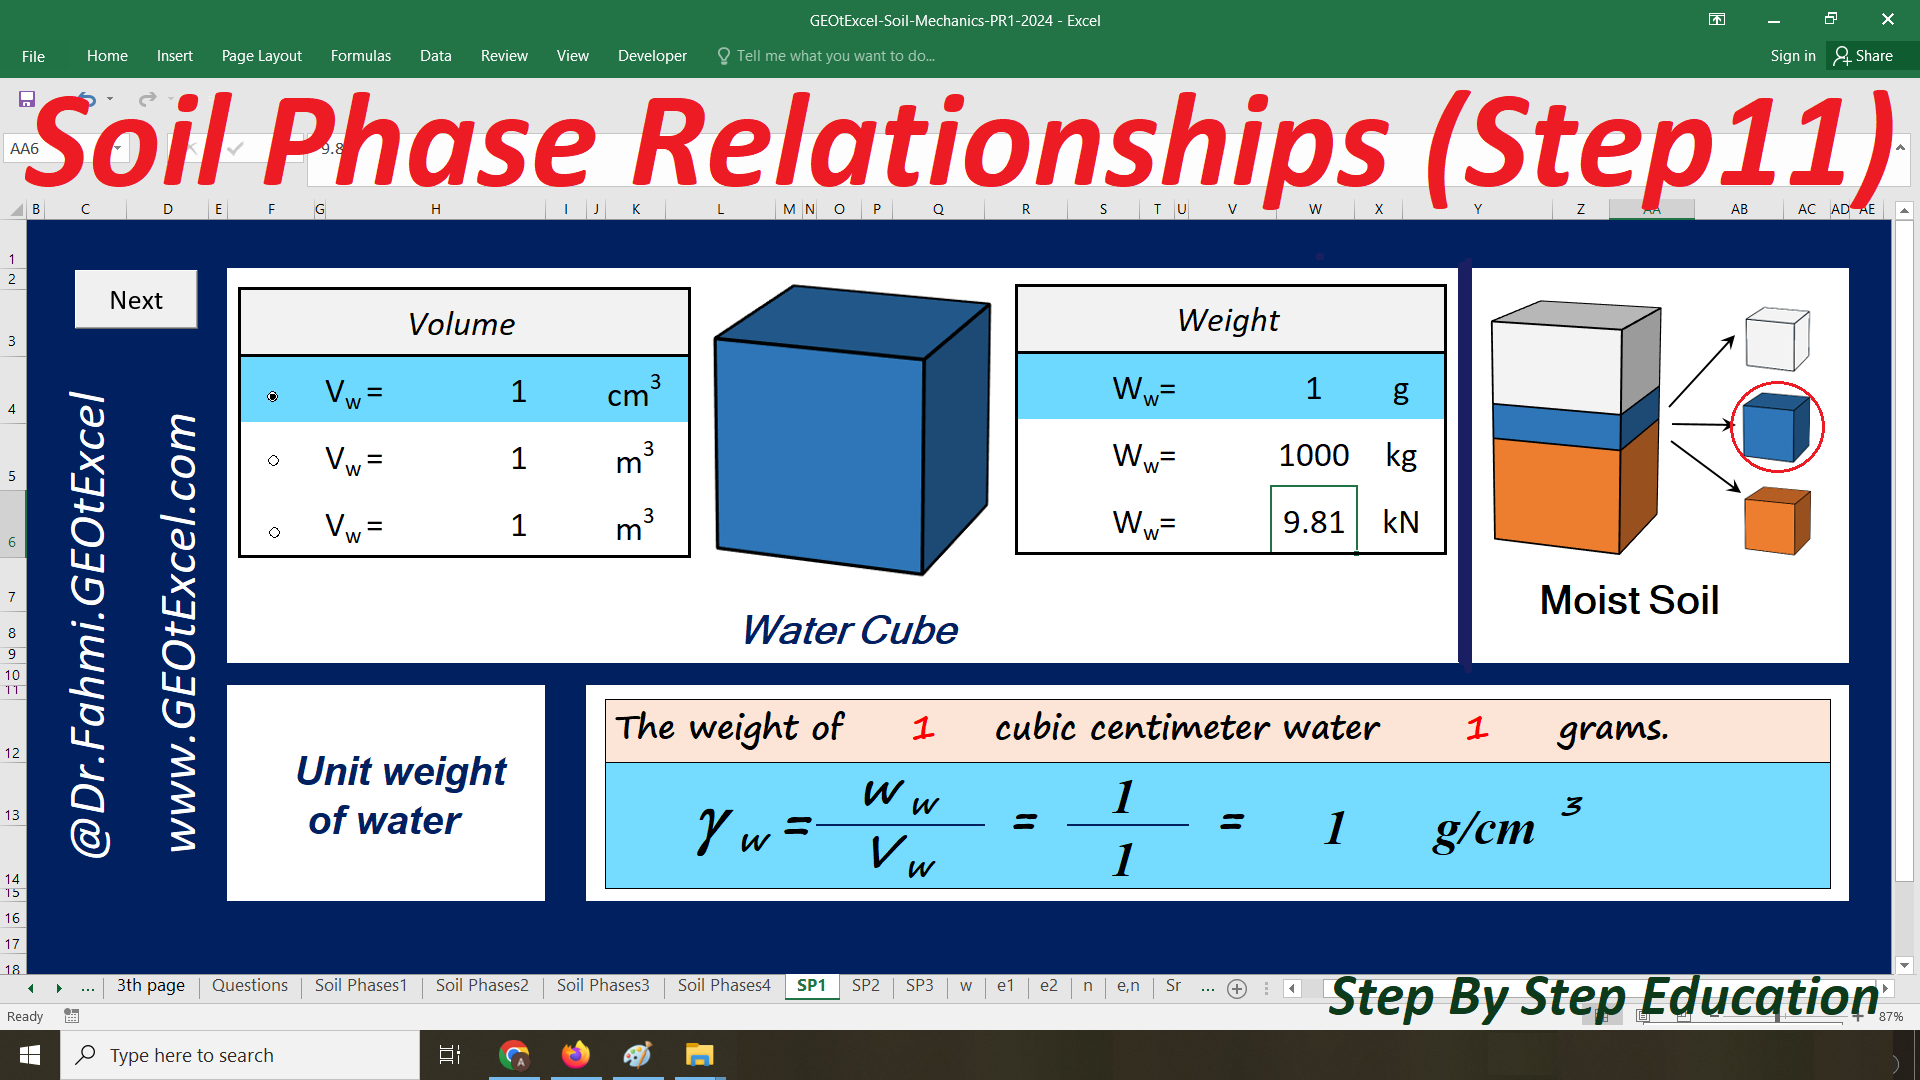
The weight of 1 cubic centimeter of water is 1 gram
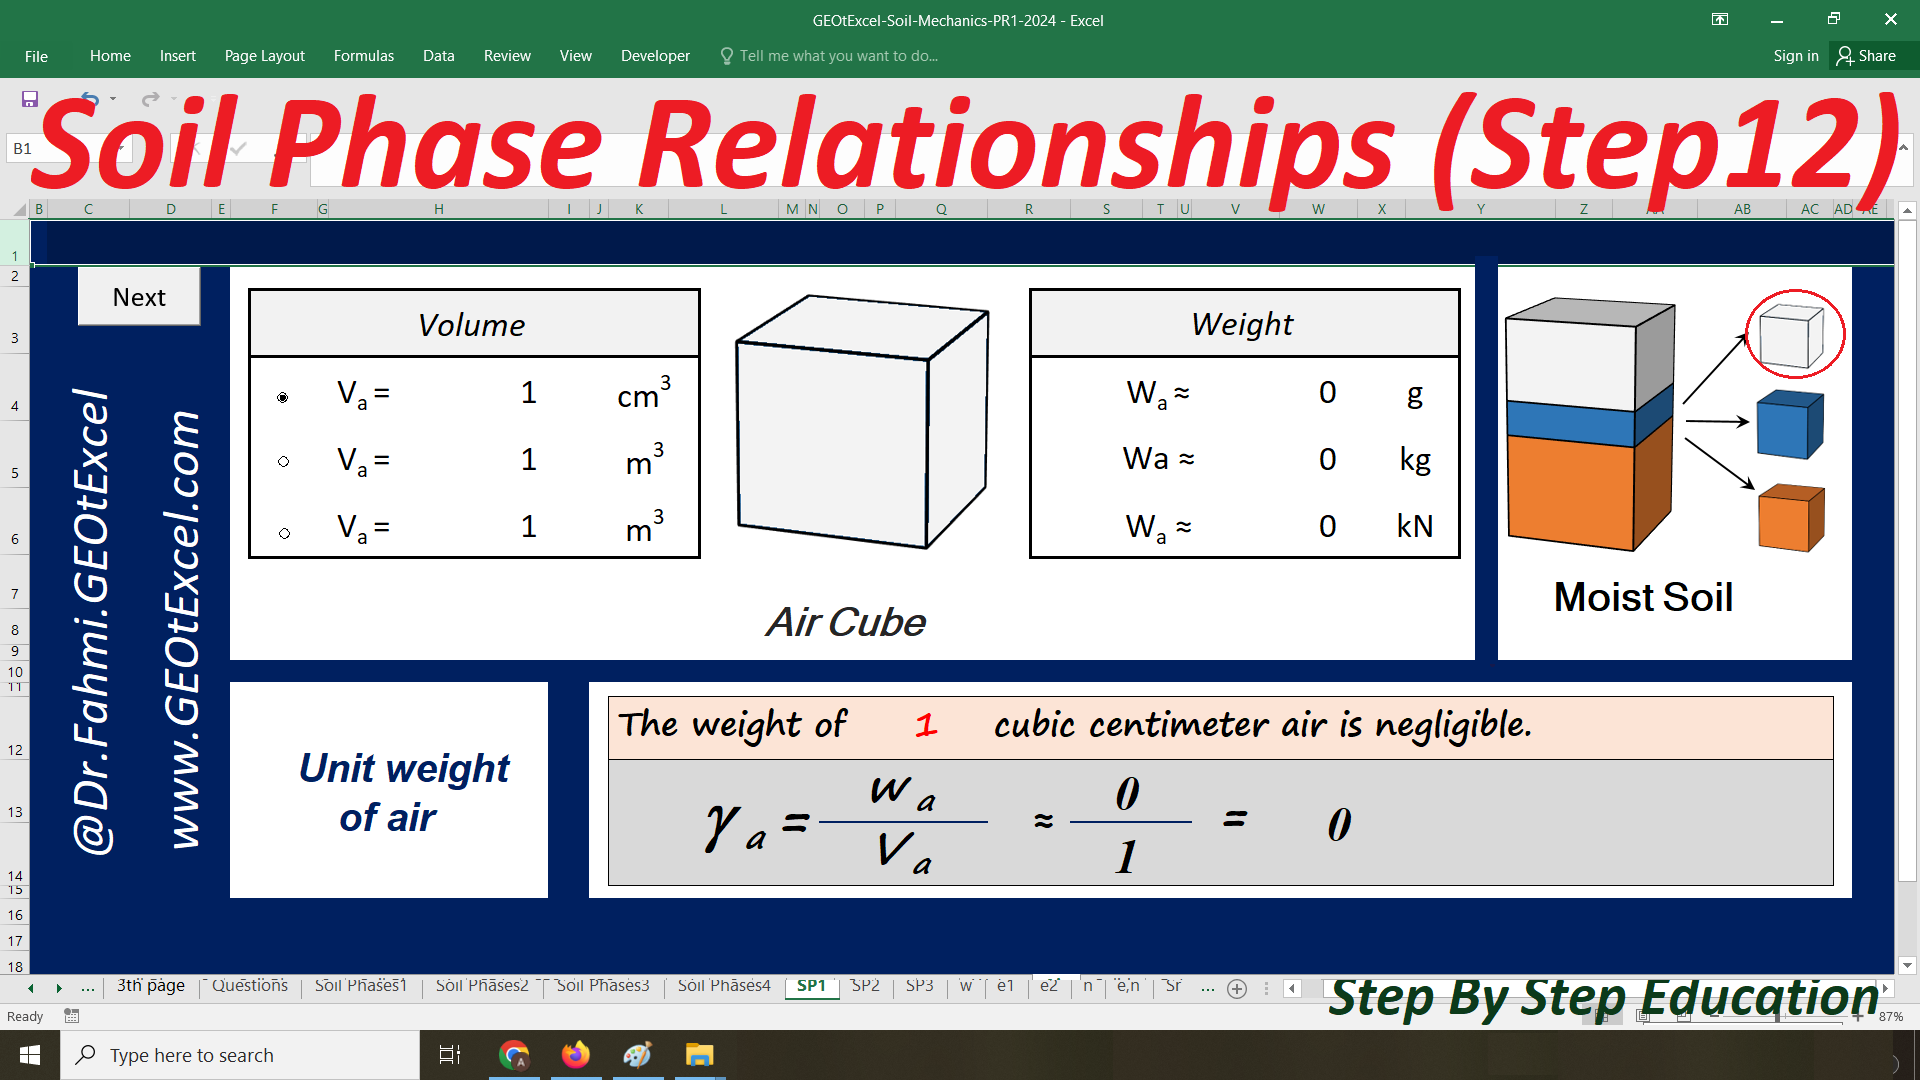
The weight of 1 cubic centimeter of air is negligible
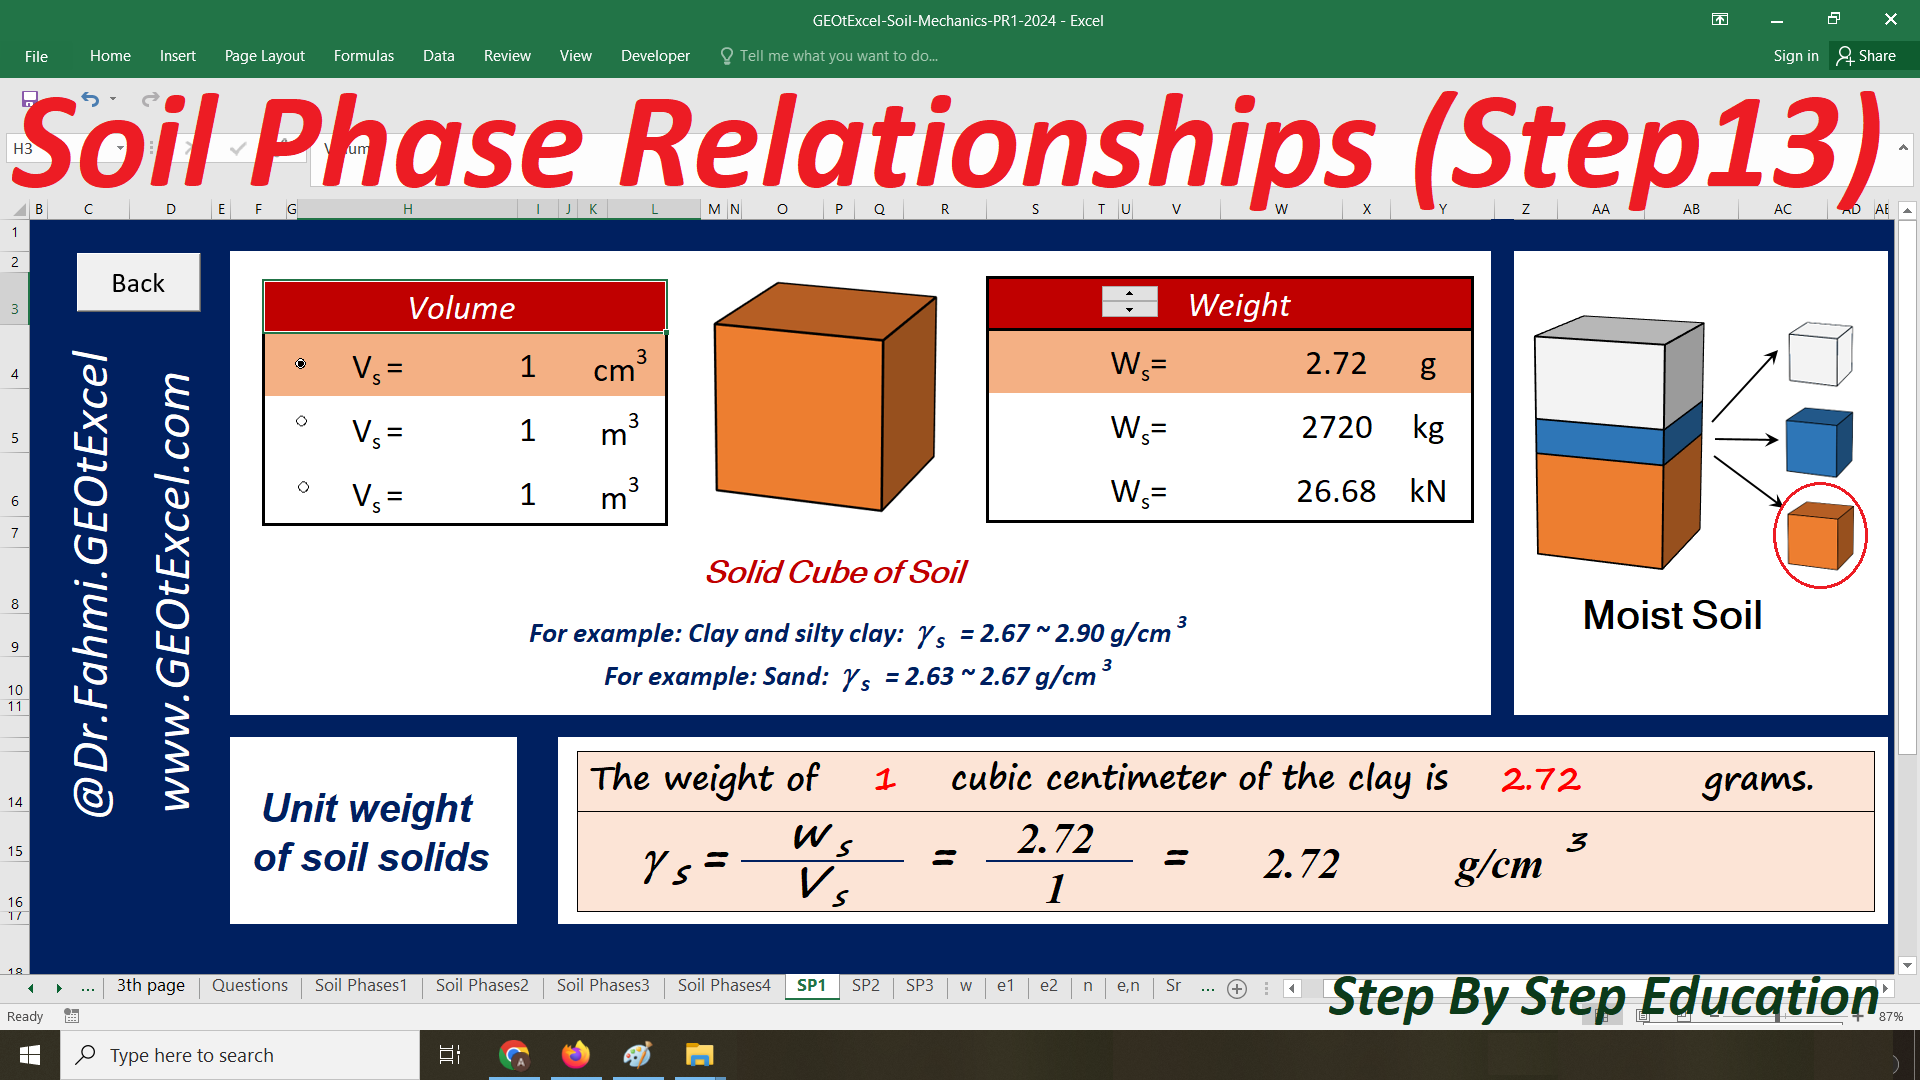
The weight of 1 cubic centimeter of the clay is 2.72 grams (in this example)
Specific Gravity or Relative density of soil solids
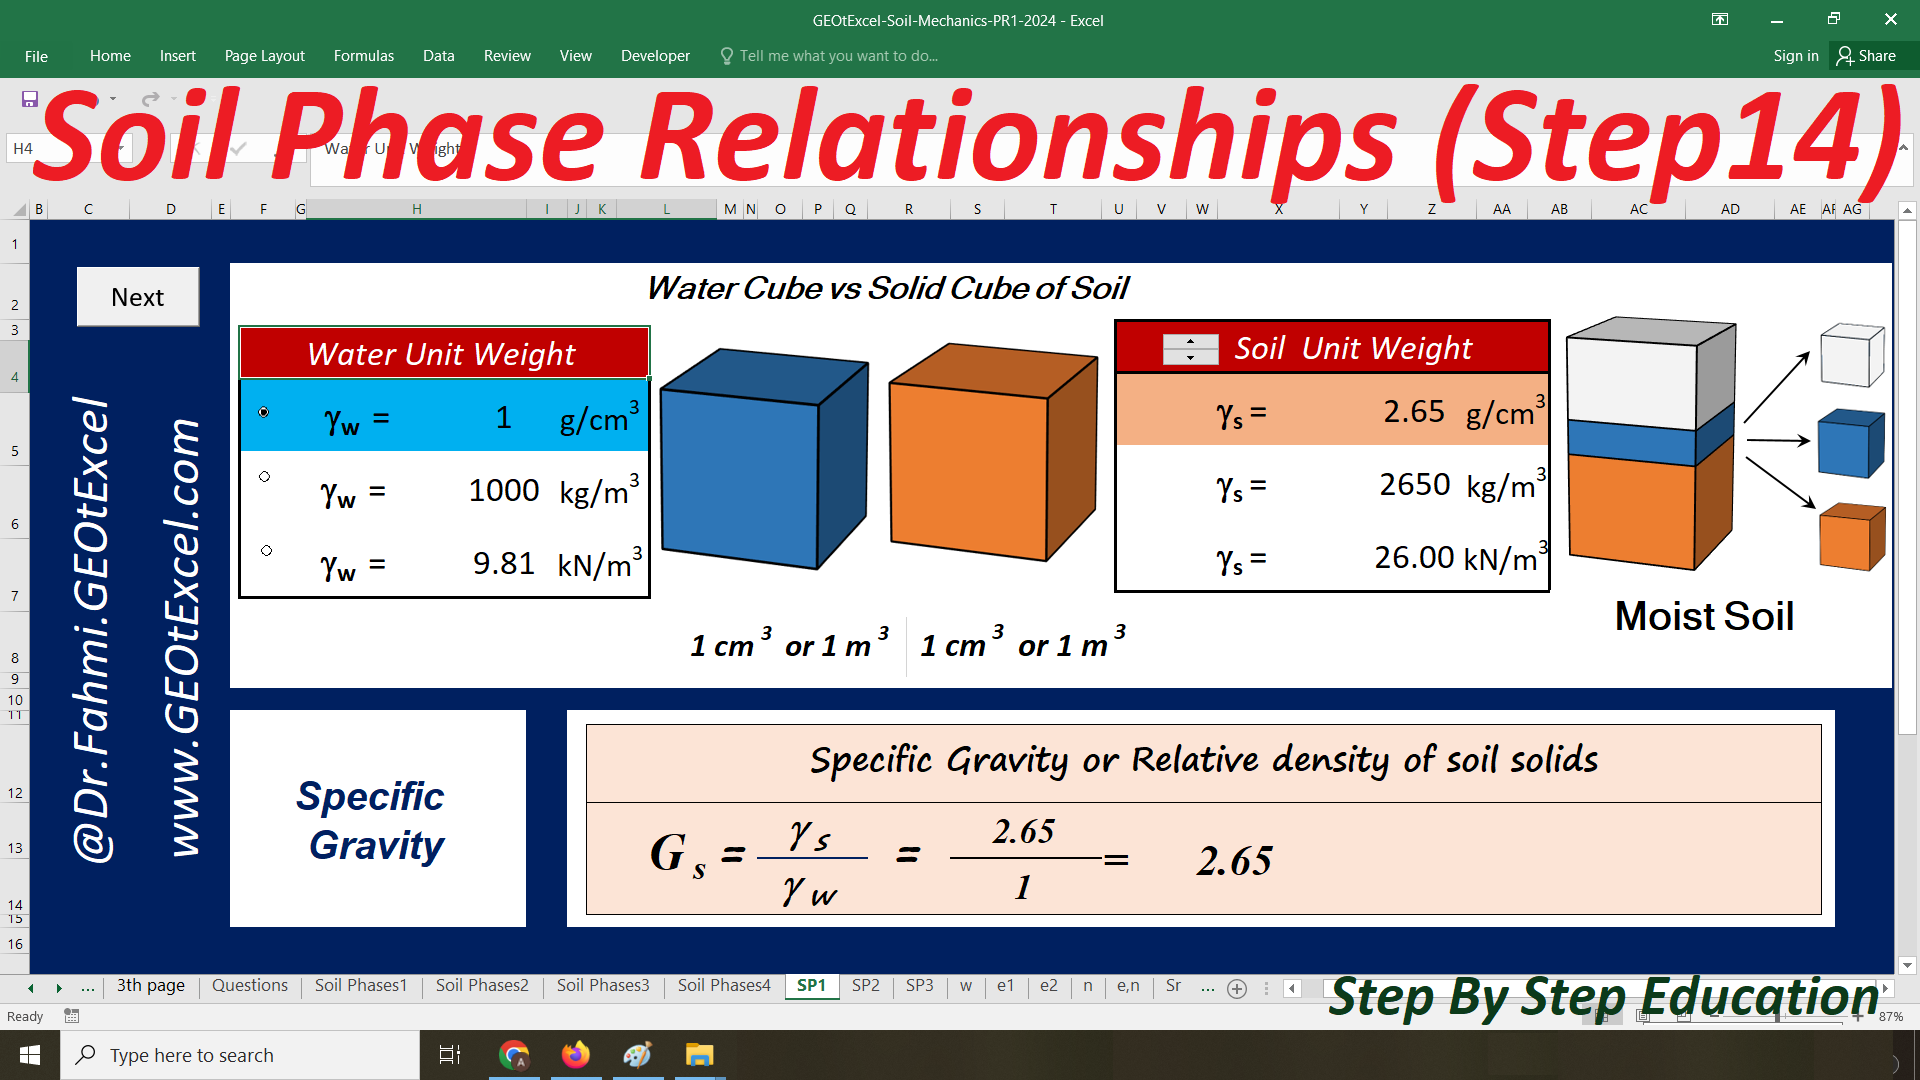
Specific Gravity or Relative density of soil solids
Phase 1: Unit weight of air
Phase 2: Unit weight of water
Phase 3: Unit weight of soil solids
3-Phase Soil: Unit weight
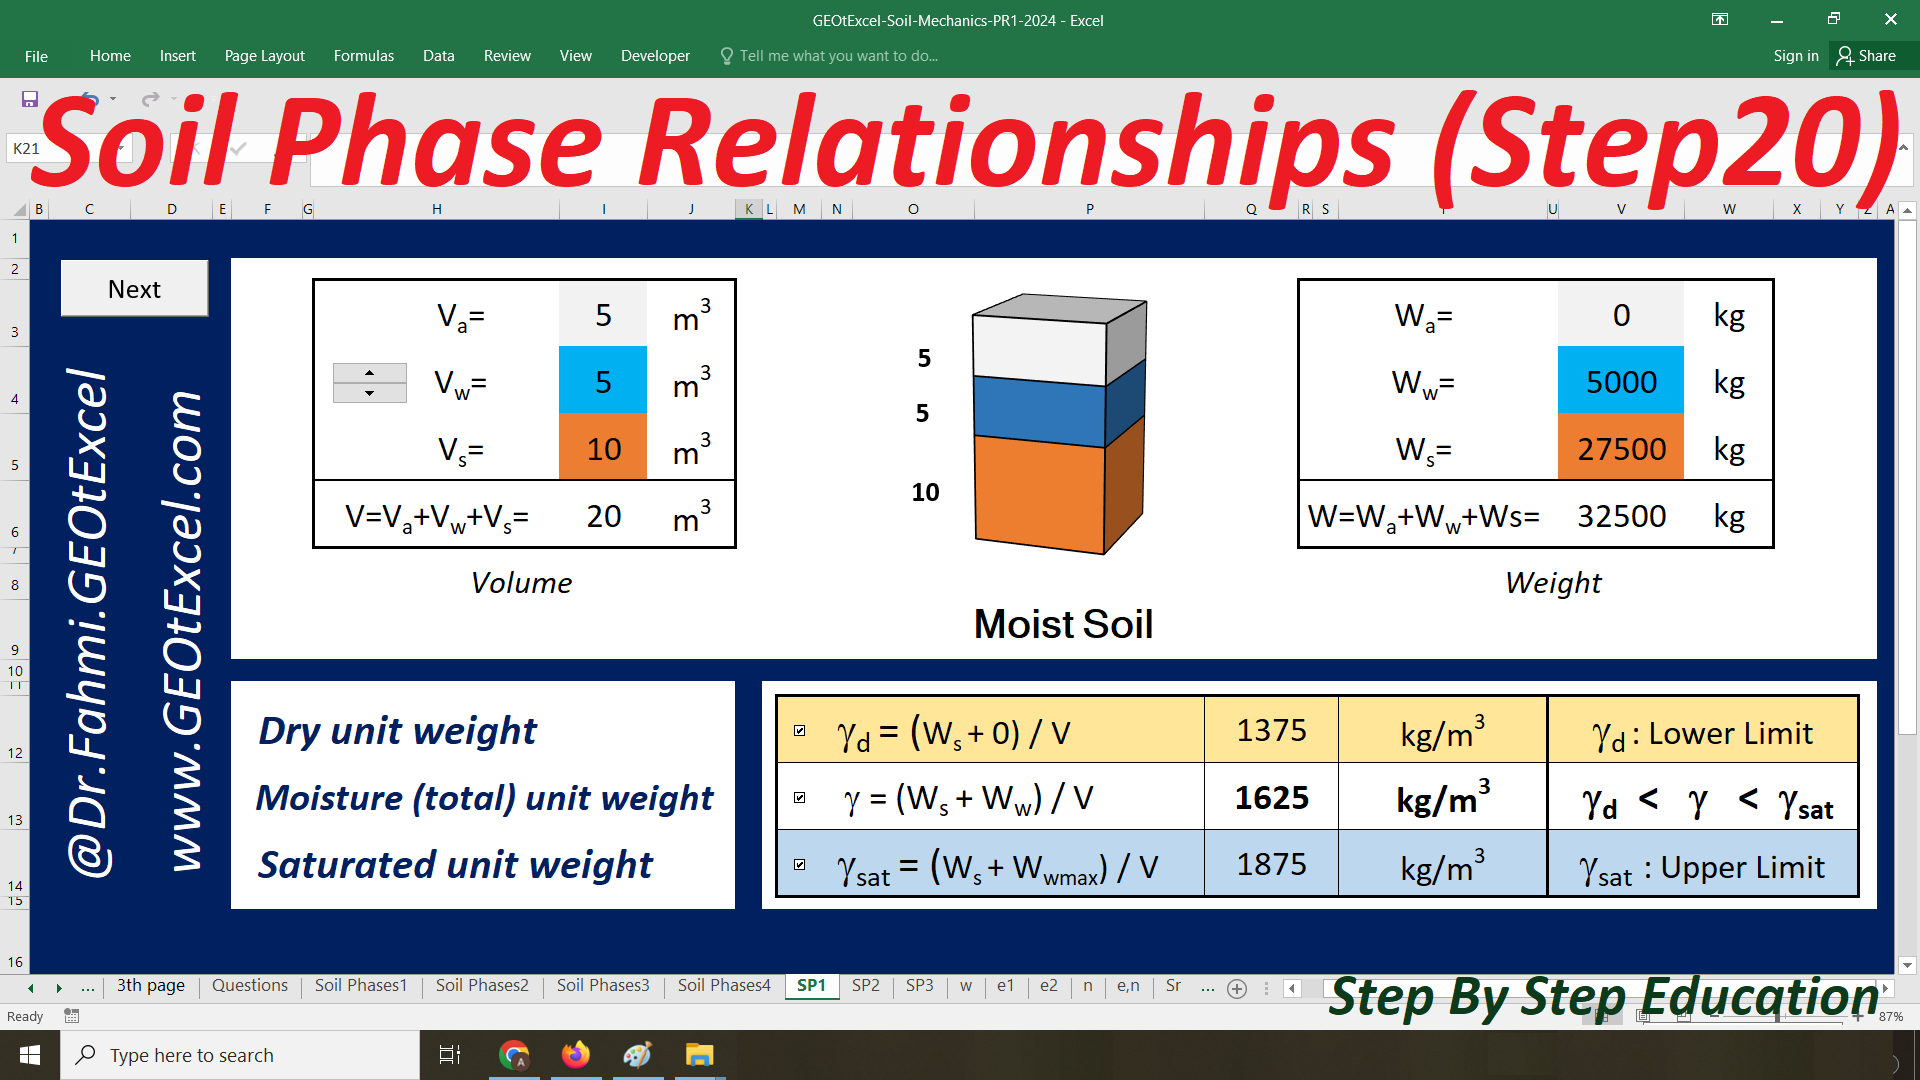
Dry Unit Weight
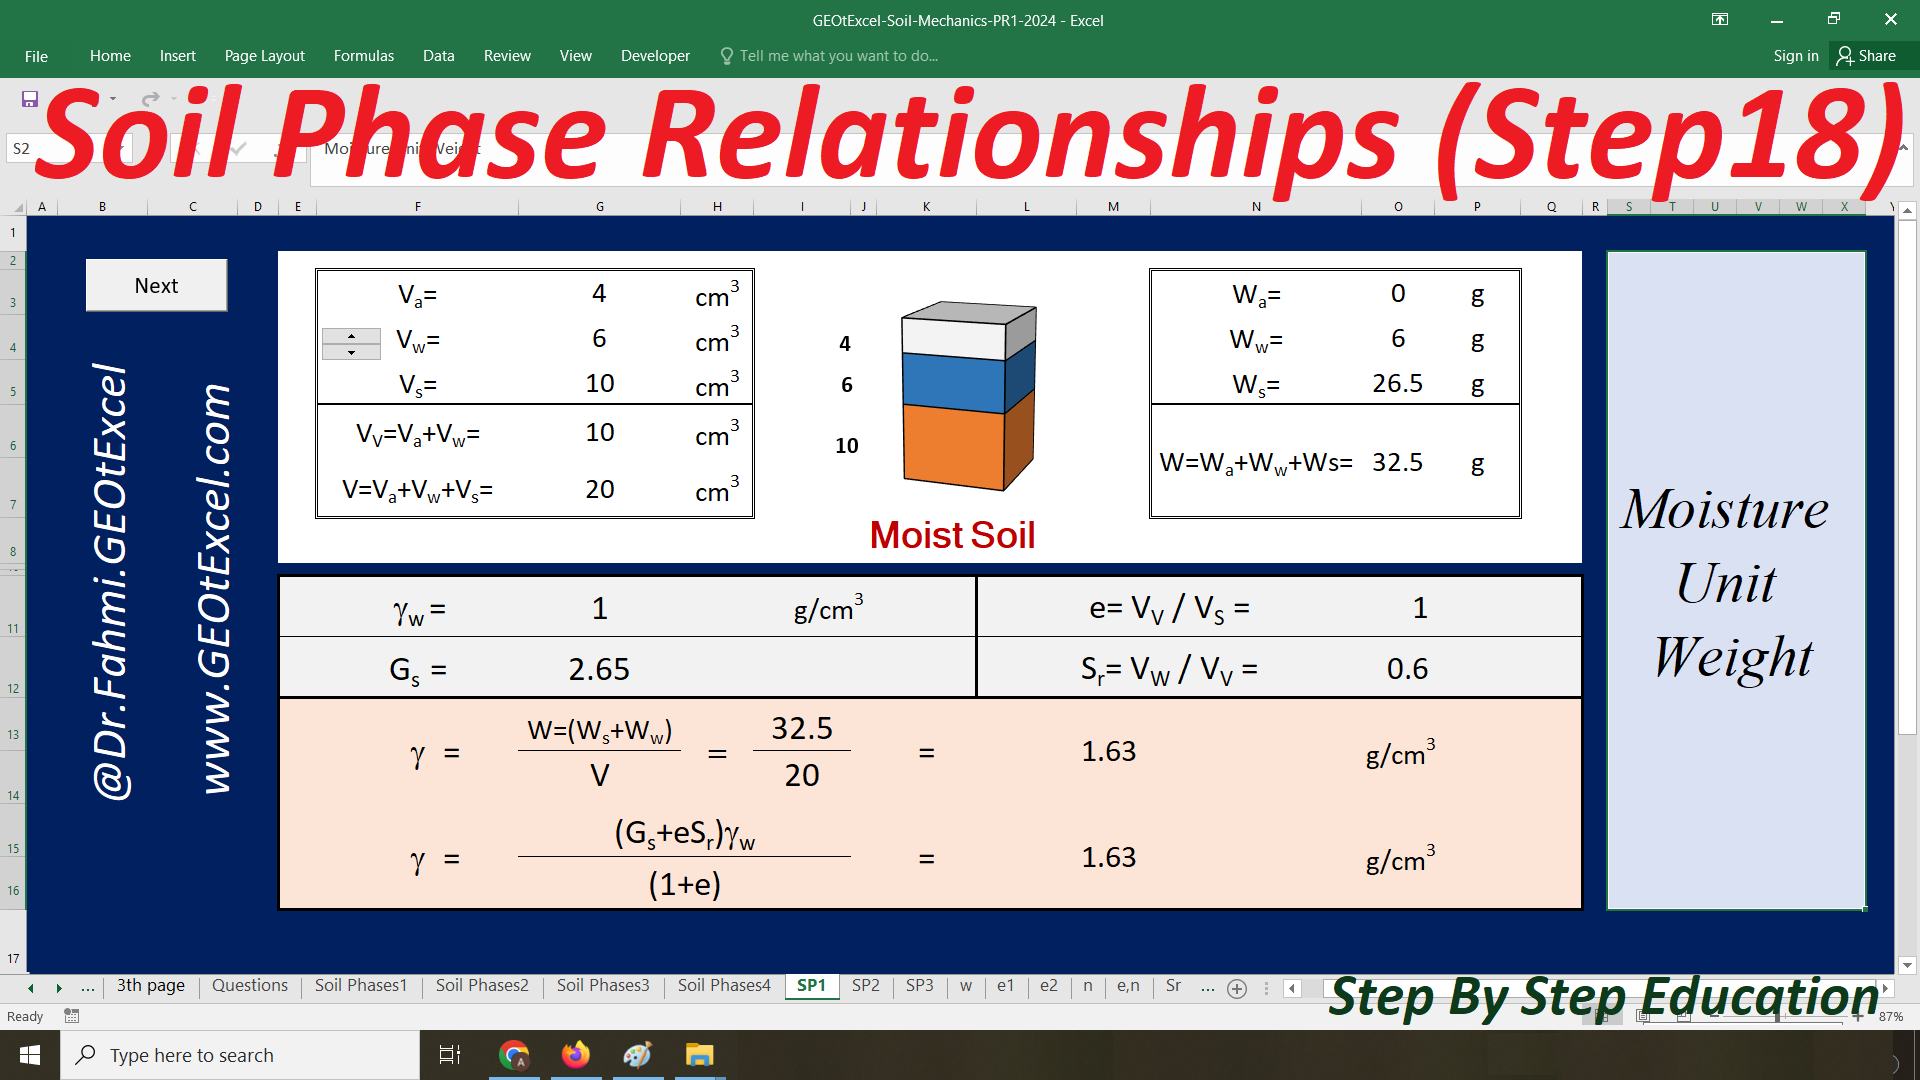
Moisture Unit Weight
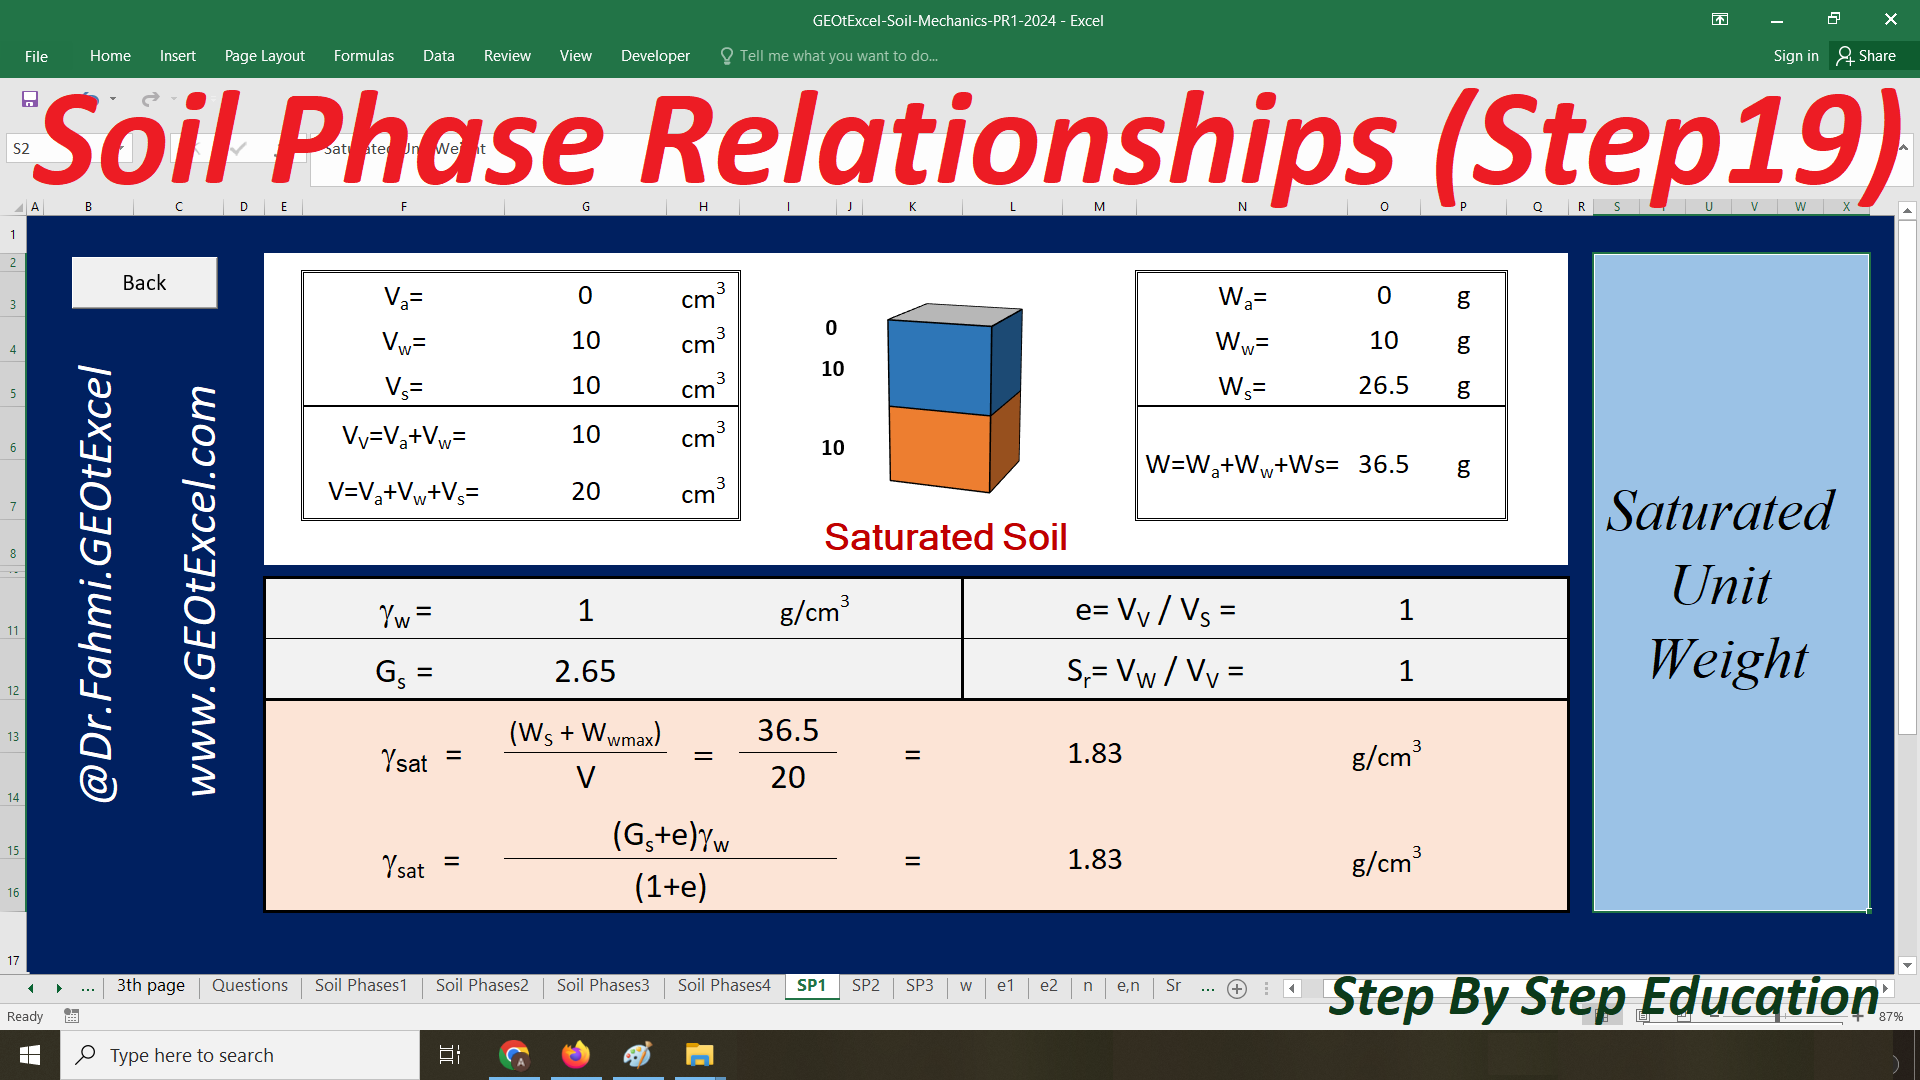
Saturated Unit Weight
Dry unit weight
Moisture (total) unit weight
Saturated unit weight
w.Gs=Sr.e
Dry unit weight & Moisture (total) unit weight Relationship
✅ Instagram Page Address:☑ https://www.instagram.com/academy.dr.fahmi
✅ Excel Spreadsheets for Soil Mechanics & Foundation Engineering
✅ Geotechnical Excel Programs & Lectures
https://www.youtube.com/@Dr.Fahmi.GEOtExcel
Designed by Dr. Ahmad Fahmi
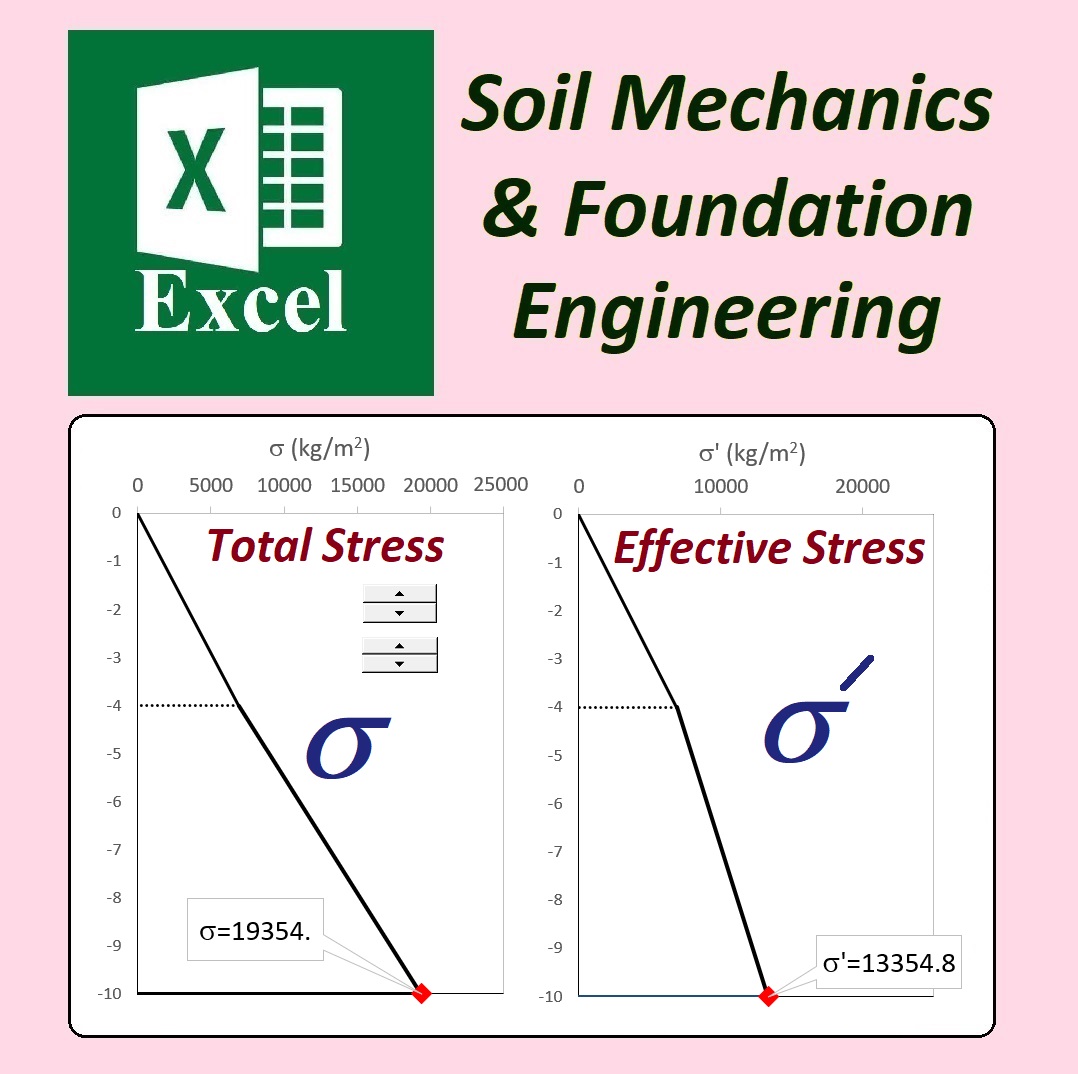
How to Efficiently Calculate Effective Stress, Total Stress, and Pore Water Pressure Using Excel Spreadsheets?
Effective Stress, Total Stress, and Pore Water Pressure Calculation
Watch the Related Videos on Our YouTube Channel (in English)
To efficiently calculate effective stress, total stress, and pore water pressure using Excel spreadsheets, start by organizing your data, such as soil depth, unit weights, and water levels, in a clear and logical layout. Set up separate columns for each input variable to keep the data structured and easy to update. Next, apply Excel functions to calculate total stress based on the depth of the soil and its unit weight, and pore water pressure by considering the water conditions. The effective stress is then determined by subtracting pore water pressure from total stress. Excel’s features like auto-calculation, data validation, and conditional formatting can streamline the process, ensuring accuracy and allowing you to easily modify inputs to explore different scenarios. This setup provides a simple yet powerful tool for performing geotechnical stress analysis.
https://www.youtube.com/@Dr.Fahmi.GEOtExcel
Designed by Dr. Ahmad Fahmi
How is the flow rate through the soil beneath a concrete dam calculated? Excel sheet
How is the flow rate through the soil beneath a concrete dam calculated
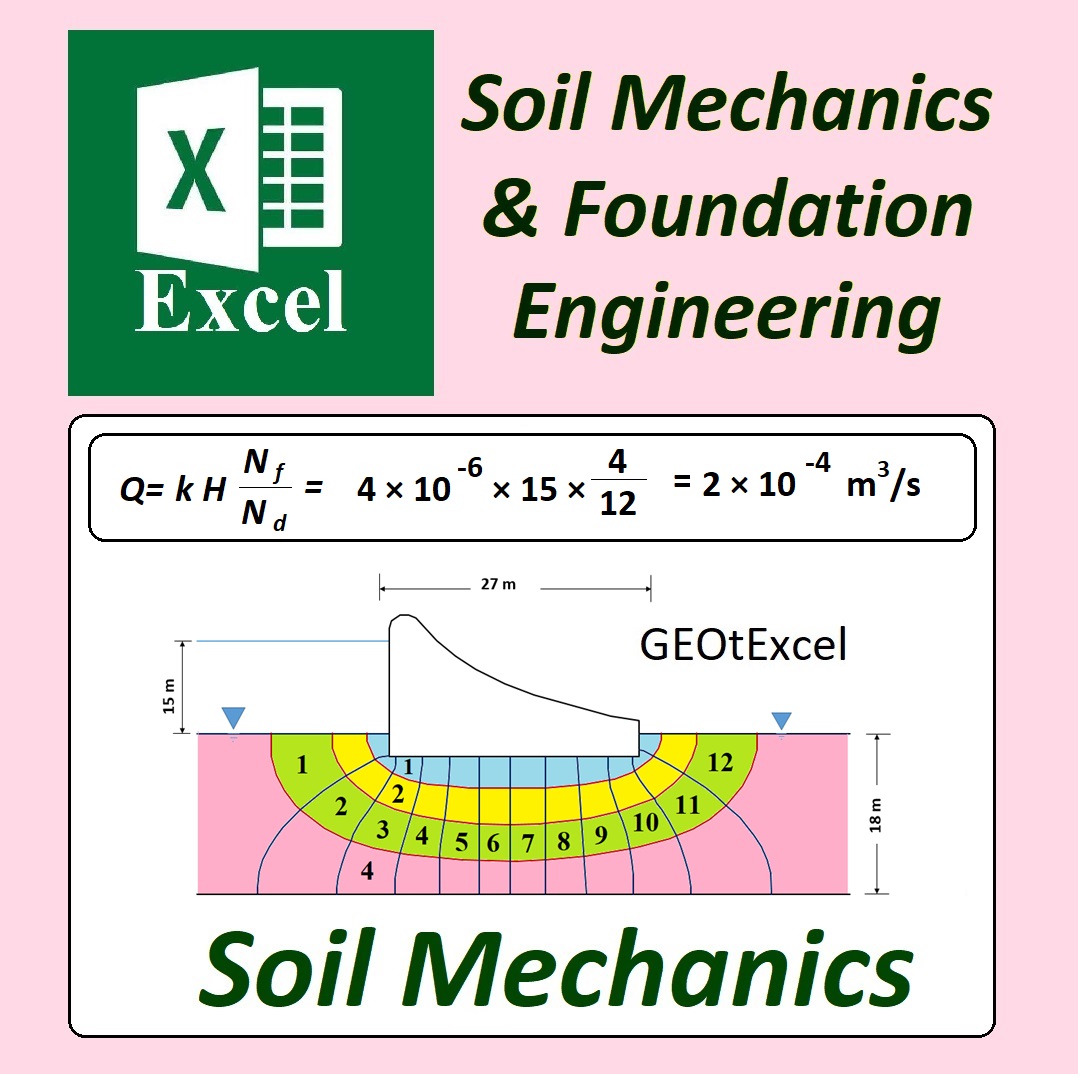
Flow rate calculation: Innovative unique Excel Spreadsheet
Watch the video on our YouTube channel
Instagram Page Address
https://www.instagram.com/academy.dr.fahmi/
Excel Spreadsheets for Soil Mechanics & Foundation Engineering
Geotechnical Excel Programs & Lectures
Let's make education a delightful and enriching experience together
https://www.youtube.com/@Dr.Fahmi.GEOtExcel
Calculating the flow rate of water through the soil beneath a concrete dam is crucial for maintaining the dam's stability and safety. This process requires a comprehensive understanding of seepage, which describes how water interacts with and moves through the soil. Using an Excel spreadsheet, you can streamline the calculation by inputting soil properties (such as permeability), hydraulic gradients, and cross-sectional areas to compute the flow rate through Darcy's Law. Excel’s formulas and data visualization tools allow for clear graphical representation of seepage calculations.
Designed by Dr. Ahmad Fahmi
#GEOtExcel #soilmechanics #excelspreadsheets #geotechnics #geotechnicalengineering #soil_mechanics #excel #excelsheet #shearstress #microsoftexcel
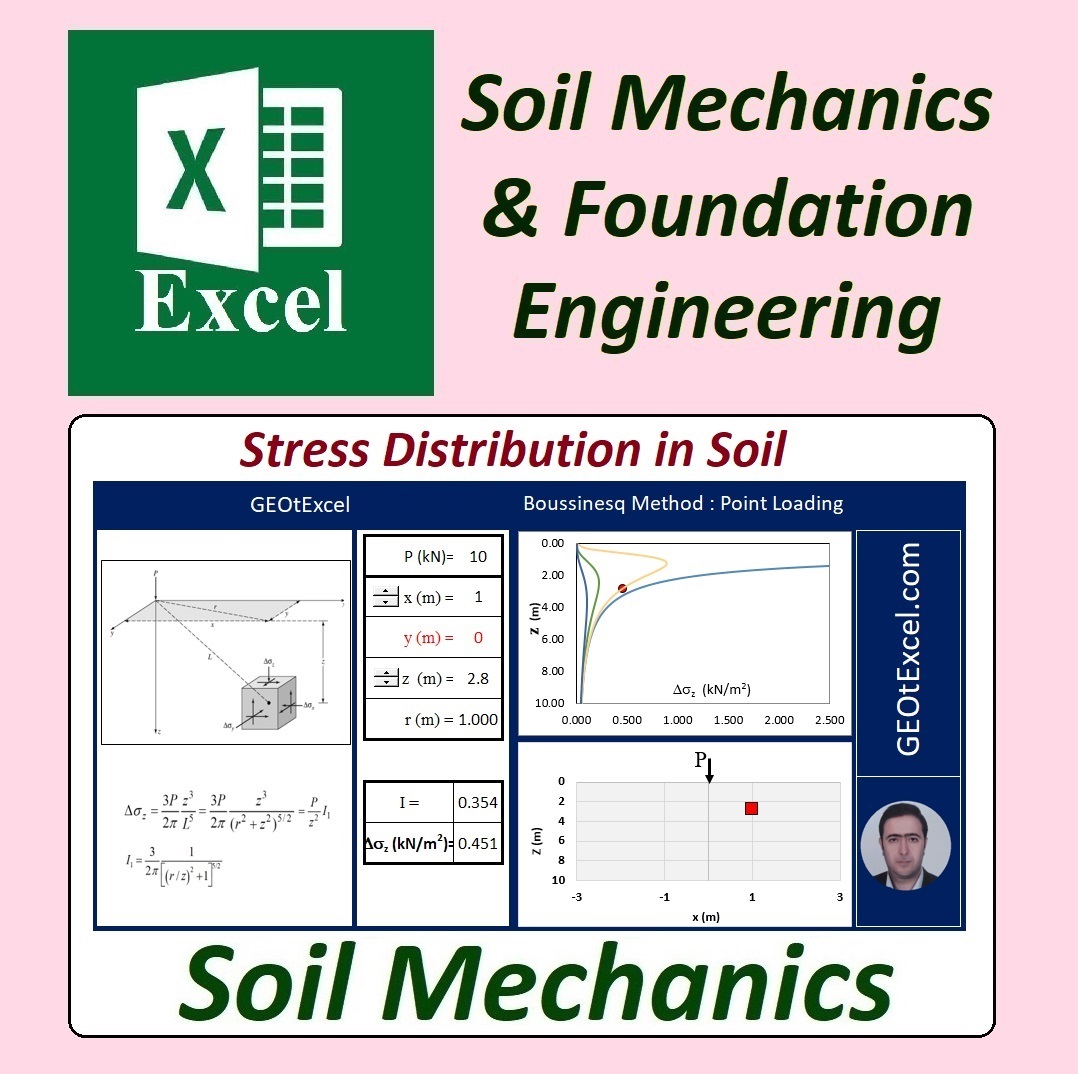
How to effectively learn the concept of “Stress Distribution in Soil” using Excel spreadsheets
Stress Distribution in Soil: Boussinesq’s Method (Point Load)
Watch the Video on Our YouTube Channel (in English)
To effectively learn the concept of “Stress Distribution in Soil” using Excel spreadsheets, you can create interactive models to visualize and calculate how stress disperses under loads. By inputting parameters such as soil properties, point or distributed loads, and depth, Excel can be used to apply formulas like Boussinesq’s method or Westergaard’s theory. The spreadsheet can then automatically compute stress values at different points and generate charts or stress bulbs, making the process more intuitive and dynamic. This hands-on approach helps in understanding the complex behavior of stress distribution through visualization and iterative calculations.
https://www.youtube.com/@Dr.Fahmi.GEOtExcel
Designed by Dr. Ahmad Fahmi
How to effectively learn the concept of "Stress Bulb" using Excel spreadsheets
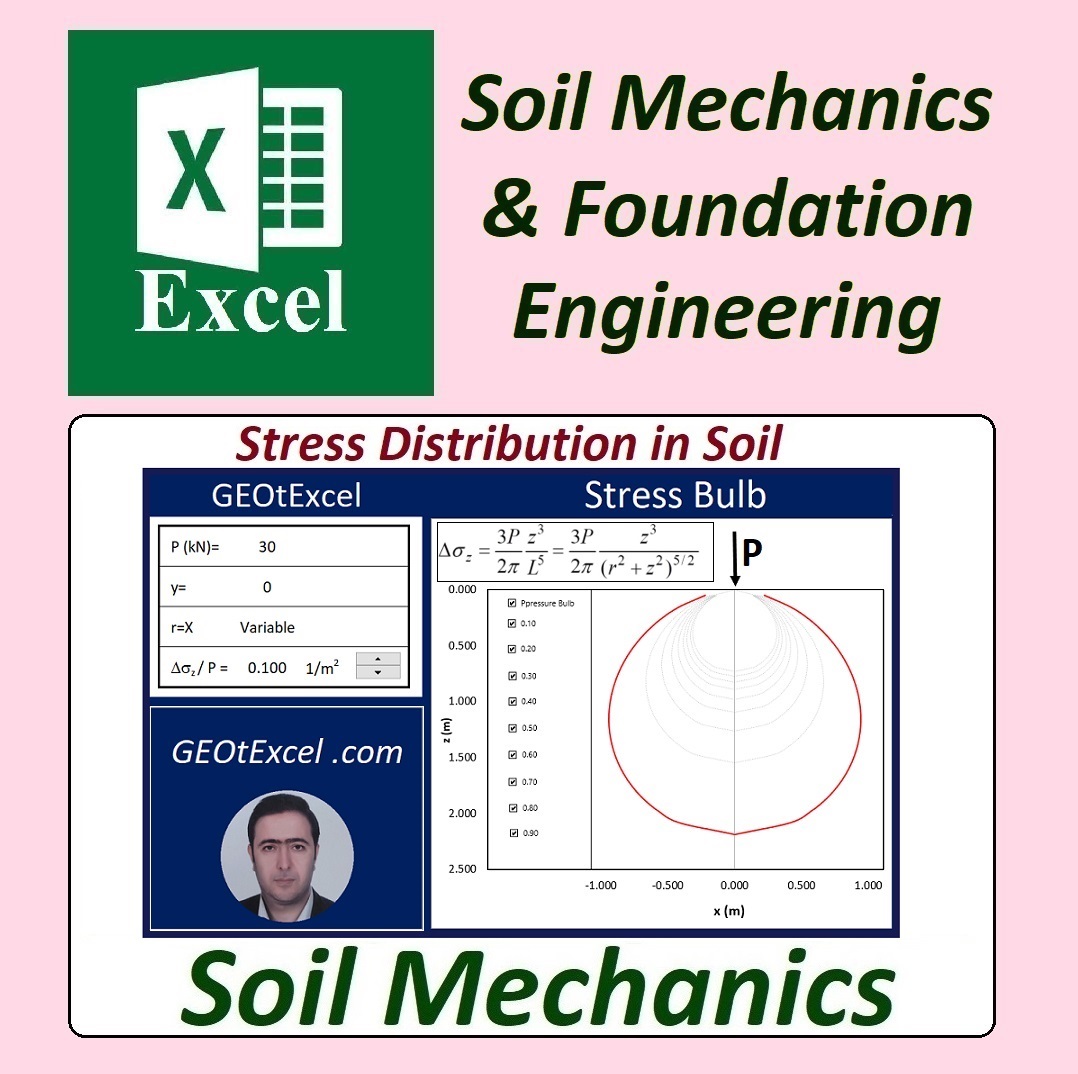
Stress Distribution in Soil: Stress Bulb: Boussinesq's Method (Point Load)
Watch the Video on Our YouTube Channel (in English)
Stress distribution in soil due to a point load can be analyzed using Boussinesq's method, which provides a way to calculate how stresses spread within a soil mass. The concept of a "stress bulb" represents the area beneath the surface where the stress decreases with depth and distance from the point of load application. Boussinesq’s method assumes an elastic, isotropic, and homogeneous medium, and it helps in visualizing how vertical stress from a surface load disperses in a bulb-like pattern, with higher stresses near the load and diminishing stresses as the depth and lateral distance increase.
https://www.youtube.com/@Dr.Fahmi.GEOtExcel
Designed by Dr. Ahmad Fahmi